A | B | C | D | E | F | G | H | CH | I | J | K | L | M | N | O | P | Q | R | S | T | U | V | W | X | Y | Z | 0 | 1 | 2 | 3 | 4 | 5 | 6 | 7 | 8 | 9
| |||||||||||||||||||||||||||||||||||||||||
All 123 seats to Cornwall Council 62 seats needed for a majority | |||||||||||||||||||||||||||||||||||||||||
|---|---|---|---|---|---|---|---|---|---|---|---|---|---|---|---|---|---|---|---|---|---|---|---|---|---|---|---|---|---|---|---|---|---|---|---|---|---|---|---|---|---|
| |||||||||||||||||||||||||||||||||||||||||
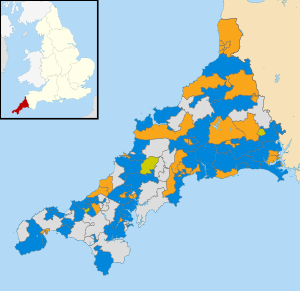
 Map showing the results of the 2009 Cornwall Council elections results by electoral division. Blue showing Conservative, yellow showing Liberal Democrats, grey showing independents and old gold showing Mebyon Kernow. | |||||||||||||||||||||||||||||||||||||||||
The Cornwall Council election, 2009, was an election for all 123 seats on the council. Cornwall Council is a unitary authority that covers the majority of the ceremonial county of Cornwall, with the exception of the Isles of Scilly which have an independent local authority. The elections took place concurrently with other local elections across England and Wales as well as the UK component of the elections to the European Parliament. Cornwall had seen its district and county councils abolished, replaced by a single 123-member Cornish unitary authority, for which councillors were elected for a full term.
All locally registered electors (British, Irish, Commonwealth and European Union citizens) who were aged 18 or over on Thursday 2 May 2009 were entitled to vote in the local elections. Those who were temporarily away from their ordinary address (for example, away working, on holiday, in student accommodation or in hospital) were also entitled to vote in the local elections,[1] although those who had moved abroad and registered as overseas electors cannot vote in the local elections. It is possible to register to vote at more than one address (such as a university student who had a term-time address and lives at home during holidays) at the discretion of the local Electoral Register Office, but it remains an offence to vote more than once in the same local government election.[2]
There were 123 members elected, replacing the previous 82 councillors on Cornwall County Council and the 249 on the six district councils.[3] The outgoing Cornwall County Council had 48 Liberal Democrat members, nine Conservatives, five Labour, one from the small Liberal Party with the remaining 19 seats held by Independent candidates. Mebyon Kernow had no county councillors, but nine district councillors, before the two-tier system was abolished.[4]
The Lib Dems lost overall control of Cornwall Council to 'no overall control' – this means that no single party has overall control of the new council despite the Conservatives have the largest number of councillors, however they do not have enough for a majority control.[5] The cabinet of the council was therefore formed as a coalition between the Conservatives and the Independent bloc.[6] The Conservatives received 34% of the vote (50 seats), followed by the Liberal Democrats on 28% (38 seats), the Independents on 23% (32 seats) and Mebyon Kernow on 4% (3 seats). The turnout was 41%. Labour, the Green Party, UKIP and the BNP failed to secure any seats in Cornwall.[7]
Results
| 2009 Cornwall Council election | ||||||||
|---|---|---|---|---|---|---|---|---|
| Party | Seats | Seats % | Votes % | Votes | Candidates | Av. Votes | Av. Votes % | |
| Conservative | 50 | 40.7% | 33.8% | 57,115 | 123 | 464 | 33.8% | |
| Liberal Democrats | 38 | 30.9% | 28.2% | 47,801 | 119 | 402 | 29.3% | |
| Independent | 32 | 26.0% | 23.8% | 40,193 | 106 | 379 | 27.5% | |
| Mebyon Kernow | 3 | 2.4% | 4.3% | 7,290 | 33 | 221 | 16% | |
| UKIP | 0 | 0% | 3.8% | 6,350 | 26 | 244 | 18% | |
| Labour | 0 | 0% | 3.4% | 5,698 | 59 | 97 | 7.1% | |
| Green | 0 | 0% | 1.9% | 3,139 | 16 | 196 | 14.6% | |
| Liberal | 0 | 0% | 0.6% | 945 | 9 | 105 | 8.2% | |
| BNP | 0 | 0% | 0.2% | 363 | 4 | 91 | ||
| English Democrat | 0 | 0% | 0.1% | 81 | 1 | 81 | ||
Electoral division results
The electoral division results listed below.[8]
| Party | Candidate | Votes | % | ||
|---|---|---|---|---|---|
| Conservative | Philip Percival Parsons | 639 | 40.6 | ||
| Independent | David William Eno | 559 | 35.5 | ||
| Liberal Democrats | Ken Scoble | 375 | 23.8 | ||
| Majority | 80 | 5.1 | |||
| Turnout | 1,573 | 49.2 | |||
| Conservative win (new seat) | |||||
| Party | Candidate | Votes | % | ||
|---|---|---|---|---|---|
| Liberal Democrats | Pat Rogerson | 532 | 49.8 | ||
| Conservative | Peter Bray | 300 | 28.1 | ||
| Independent | Linda Spear | 236 | 22.1 | ||
| Majority | 232 | 21.7 | |||
| Turnout | 1,068 | 28.5 | |||
| Liberal Democrats win (new seat) | |||||
| Party | Candidate | Votes | % | ||
|---|---|---|---|---|---|
| Conservative | Lance Kennedy | 540 | 51.6 | ||
| Liberal Democrats | Steve Rogerson | 507 | 48.4 | ||
| Majority | 33 | 3.2 | |||
| Turnout | 1,047 | 32.7 | |||
| Conservative win (new seat) | |||||
