

A | B | C | D | E | F | G | H | CH | I | J | K | L | M | N | O | P | Q | R | S | T | U | V | W | X | Y | Z | 0 | 1 | 2 | 3 | 4 | 5 | 6 | 7 | 8 | 9
Northumberland County Council elections
...
This article needs additional citations for verification. (June 2018) |
Northumberland County Council elections are held every four years. Northumberland County Council is the local authority for the unitary authority of Northumberland in England. Since the last boundary changes in 2013, 67 councillors have been elected from 66 wards.[1]
Council elections
- 1973 Northumberland County Council election
- 1977 Northumberland County Council election
- 1981 Northumberland County Council election
- 1985 Northumberland County Council election
- 1989 Northumberland County Council election
- 1993 Northumberland County Council election
- 1997 Northumberland County Council election
- 2001 Northumberland County Council election
- 2005 Northumberland County Council election
- 2008 Northumberland County Council election
- 2013 Northumberland County Council election
- 2017 Northumberland County Council election
- 2021 Northumberland County Council election
Council composition
| Year | Conservative | Labour | Liberal Democrats | Liberal | Green | Independent | Control |
|---|---|---|---|---|---|---|---|
| 1973 | 10 | 28 | - | 3 | - | 21 | No overall control |
| 1977 | 20 | 21 | - | 0 | - | 21[a] | No overall control |
| 1981 | 14 | 34 | - | 15 | - | 3 | Labour |
| 1985 | 12 | 30 | - | 20 | - | 4[b] | No overall control |
| 1989 | 17 | 38 | 8 | - | - | 3 | Labour |
| 1993 | 13 | 39 | 11 | - | 0 | 5 | Labour |
| 1997 | 13 | 43 | 8 | - | 0 | 2 | Labour |
| 2001 | 17 | 38 | 9 | - | 0 | 3 | Labour |
| 2005 | 14 | 35 | 14 | - | 0 | 4 | Labour |
| 2008 | 17 | 17 | 26 | - | 0 | 7 | No overall control |
| 2013 | 21 | 32 | 11 | - | 0 | 3 | No overall control |
| 2017 | 33 | 24 | 3 | - | 0 | 7 | No overall control |
| 2021 | 34 | 21 | 3 | - | 2 | 7 | Conservative |
County result maps
-
 1981 results map
 -
 1985 results map
 -
 1989 results map
 -
 1993 results map
 -
 1997 results map
 -
 2001 results map
 -
 2005 results map
 -
 2008 results map
 -
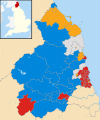
 2013 results map
 -
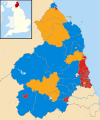
 2017 results map
 -
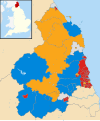
 2021 results map


By-election results
1997-2001
| Party | Candidate | Votes | % | ±% | |
|---|---|---|---|---|---|
| Conservative | 546 | 35.8 | +0.5 | ||
| Liberal Democrats | 420 | 27.5 | -9.6 | ||
| Labour | 307 | 20.1 | -7.5 | ||
| Independent | 253 | 16.8 | +16.8 | ||
| Majority | 126 | 8.3 | |||
| Turnout | 1,526 | ||||
| Conservative gain from Liberal Democrats | Swing | ||||
| Party | Candidate | Votes | % | ±% | |
|---|---|---|---|---|---|
| Liberal Democrats | 720 | 58.7 | +58.7 | ||
| Labour | 483 | 39.4 | -39.8 | ||
| Conservative | 23 | 1.9 | -18.9 | ||
| Majority | 237 | 19.3 | |||
| Turnout | 1,226 | ||||
| Liberal Democrats gain from Labour | Swing | ||||
| Party | Candidate | Votes | % | ±% | |
|---|---|---|---|---|---|
| Labour | 574 | 58.0 | -21.3 | ||
| Liberal Democrats | 391 | 39.5 | +18.8 | ||
| Conservative | 24 | 2.4 | +2.4 | ||
| Majority | 183 | 18.5 | |||
| Turnout | 989 | 30.0 | |||
| Labour hold | Swing | ||||