A | B | C | D | E | F | G | H | CH | I | J | K | L | M | N | O | P | Q | R | S | T | U | V | W | X | Y | Z | 0 | 1 | 2 | 3 | 4 | 5 | 6 | 7 | 8 | 9
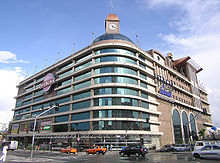
 São Paulo, the financial capital of Brazil | |
| Currency | Brazilian real (BRL, R$) |
|---|---|
| 1 January – 31 December | |
Trade organizations | WTO, BRICS, MERCOSUR, G20 and others |
Country group |
|
| Statistics | |
| Population | |
| GDP | |
| GDP rank | |
GDP growth | |
GDP per capita | |
GDP per capita rank | |
GDP by sector |
|
Population below poverty line | |
| |
Labor force | |
Labor force by occupation |
|
| Unemployment | |
Average gross salary | R$3,118 (US$578.48) monthly[17] (January 2024) |
Main industries | |
| External | |
| Exports | |
Export goods | Aircraft, armaments, steel, machinery, transport equipment, automobiles, vehicle parts, soybeans, iron ore, pulp (cellulose), maize, beef, chicken meat, soybean meal, sugar, coffee, tobacco, cotton, orange juice, footwear, gold, ethanol, semi-finished iron |
Main export partners |
|
| Imports | |
Import goods | Machinery, electrical and transport equipment, chemical products, oil, automotive parts, electronics |
Main import partners |
|
FDI stock | |
Gross external debt | |
| Public finances | |
| 0.4% (of GDP) (2021)[24] | |
| Revenues | $382.6 billion (2022)[25] |
| Expenses | $319.4 billion (2022)[25] |
All values, unless otherwise stated, are in US dollars. | |
The economy of Brazil is historically the largest in Latin America and the Southern Hemisphere in nominal terms.[30] The Brazilian economy is the second largest in the Americas. It is an upper-middle income developing mixed economy.[31] In 2024, according to International Monetary Fund (IMF), Brazil has the 8th largest gross domestic product (GDP) in the world and has the 8th largest purchasing power parity in the world.[4][5] In 2024, according to Forbes, Brazil was the 7th largest country in the world by number of billionaires.[32] According to International Monetary Fund (IMF), Brazilian nominal GDP was US$2.331 trillion, the country has a long history of being among the largest economies in the world and the GDP per capita was US$11,178 per inhabitant.[4][5]
The country is rich in natural resources. From 2000 to 2012, Brazil was one of the fastest-growing major economies in the world, with an average annual GDP growth rate of over 5%. Its GDP surpassed that of the United Kingdom in 2012, temporarily making Brazil the world's sixth-largest economy. However, Brazil's economic growth decelerated in 2013[33] and the country entered a recession in 2014. The economy started to recover in 2017, with a 1% growth in the first quarter, followed by a 0.3% growth in second quarter compared to the same period of the previous year. It officially exited the recession.
According to the World Economic Forum, Brazil was the top country in upward evolution of competitiveness in 2009, gaining eight positions among other countries, overcoming Russia for the first time, and partially closing the competitiveness gap with India and China among the BRICS economies. Important steps taken since the 1990s toward fiscal sustainability, as well as measures taken to liberalize and open the economy, have significantly boosted the country's competitiveness fundamentals, providing a better environment for private-sector development.[34]
Brazil is a member of diverse economic organizations, such as Mercosur, Prosur, G8+5, G20, WTO, Paris Club, Cairns Group, and is advanced to be a permanent member of the OECD.[35]
From a colony focused on primary sector goods (sugar, gold and cotton), Brazil managed to create a diversified industrial base during the 20th century. The steel industry is a prime example of that, with Brazil being the 9th largest steel producer in 2018, and the 5th largest steel net exporter in 2018.[36] Gerdau is the largest producer of long steel in the Americas, and Vale is the largest producer of iron ore in the world.[37] Petrobras, the Brazilian oil and gas company, is the most valuable company in Latin America.[38]
History
When the Portuguese explorers arrived in the 16th century, the native tribes of current-day Brazil totaled about 2.5 million people and had lived virtually unchanged since the Stone Age. From Portugal's colonization of Brazil (1500–1822) until the late 1930s, the Brazilian economy relied on the production of primary products for exports.
In the Portuguese Empire, Brazil was a colony subjected to an imperial mercantile policy, which had three main large-scale economic production cycles – sugar, gold and from the early 19th century on, coffee. The economy of Brazil was heavily dependent on African slave labor until the late 19th century (about 3 million imported African slaves in total). In that period Brazil was also the colony with the largest number of European settlers, most of them Portuguese (including Azoreans and Madeirans) but also some Dutch (see Dutch Brazil), Spaniards, English, French, Germans, Flemish, Danish, Scottish and Sephardic Jews.
Subsequently, Brazil experienced a period of strong economic and demographic growth accompanied by mass immigration from Europe, mainly from Portugal (including the Azores and Madeira), Italy, Spain, Germany, Poland, Ukraine, Switzerland, Austria and Russia. Smaller numbers of immigrants also came from the Netherlands, France, Finland, Iceland and the Scandinavian countries, Lithuania, Belgium, Bulgaria, Hungary, Greece, Latvia, England, Ireland, Scotland, Croatia, Czech Republic, Malta, North Macedonia and Luxembourg, the Middle East (mainly from Lebanon, Syria and Armenia), Japan, the United States and South Africa, until the 1930s. In fact, international mass immigration to Brazil during the 19th century had positive effects on the country's human capital development. Immigrants usually exhibited better formal and informal training than native Brazilians and tended to have more entrepreneurial spirit. Their arrival was beneficial for the region, not only because of the skills and knowledge they brought to the country themselves, but also because of spillover effects of their human capital to the native Brazilian population. Human capital spillover effects were strongest in regions with the highest numbers of immigrants, and the positive effects are still observable today, in some regions.[39]
In 2007, with a population of over 190 million and abundant natural resources, Brazil is one of the ten largest markets in the world, producing tens of millions of tons of steel, 26 million tons of cement, 3.5 million television sets, and 3 million refrigerators. In addition, about 70 million cubic meters of petroleum were being processed annually into fuels, lubricants, propane gas, and a wide range of hundreds of petrochemicals.[40][41]
Brazil has at least 161,500 kilometers of paved roads, more than 150 gigawatts of installed electric power capacity[42] and its real per capita GDP surpassed US$9,800 in 2017.[43][44] Its industrial sector accounts for three-fifths of the South American economy's industrial production.[45] The country's scientific and technological development is argued to be attractive to foreign direct investment, in 2019, Brazil occupied the 4th largest destination for foreign investments, behind only the United States, China and Singapore.[46]
The agricultural sector, locally called the agronegócio (agro-business), has also been dynamic: for two decades this sector has kept Brazil among the most highly productive countries in areas related to the rural sector.[45] The agricultural sector and the mining sector also supported trade surpluses which allowed for massive currency gains (rebound) and external debt paydown. Due to a downturn in Western economies, Brazil found itself in 2010 trying to halt the appreciation of the real.[47]
Data from the Asian Development Bank and the Tax Justice Network show the untaxed "shadow" economy of Brazil is 39% of GDP.[48]
One of the most important corruption cases in Brazil concerns the company Odebrecht. Since the 1980s, Odebrecht has spent several billion dollars in the form of bribes to bribe parliamentarians to vote in favour of the group. At the municipal level, Odebrecht's corruption was aimed at "stimulating privatisations", particularly in water and sewer management.[49]
Data

 |
 |


The following table shows the main economic indicators in 1980–2023 (with IMF estimates for 2024–2028). Inflation below 5% is in green.[50]
| Year | GDP
(in bn. US$PPP) |
GDP per capita
(in US$ PPP) |
GDP
(in bn. US$nominal) |
GDP per capita
(in US$ nominal) |
GDP growth
(real) |
Inflation rate
(in Percent) |
Unemployment
(in Percent) |
Government debt
(in % of GDP) |
|---|---|---|---|---|---|---|---|---|
| 1980 | 570.5 | 4,811.9 | 145.8 | 1,203.6 | n/a | n/a | ||
| 1981 | n/a | n/a | ||||||
| 1982 | n/a | n/a | ||||||
| 1983 | n/a | n/a | ||||||
| 1984 | n/a | n/a | ||||||
| 1985 | n/a | n/a | ||||||
| 1986 | n/a | n/a | ||||||
| 1987 | n/a | n/a | ||||||
| 1988 | n/a | n/a | ||||||
| 1989 | n/a | n/a | ||||||
| 1990 | n/a | n/a | ||||||
| 1991 | 10.1% | n/a | ||||||
| 1992 | n/a | |||||||
| 1993 | n/a | |||||||
| 1994 | n/a | |||||||
| 1995 | n/a | |||||||
| 1996 | n/a | |||||||
| 1997 | n/a | |||||||
| 1998 | n/a | |||||||
| 1999 | n/a
Zdroj:https://en.wikipedia.org?pojem=Economy_of_Brazil Text je dostupný za podmienok Creative Commons Attribution/Share-Alike License 3.0 Unported; prípadne za ďalších podmienok. Podrobnejšie informácie nájdete na stránke Podmienky použitia.
Analytika
Antropológia Aplikované vedy Bibliometria Dejiny vedy Encyklopédie Filozofia vedy Forenzné vedy Humanitné vedy Knižničná veda Kryogenika Kryptológia Kulturológia Literárna veda Medzidisciplinárne oblasti Metódy kvantitatívnej analýzy Metavedy Metodika Text je dostupný za podmienok Creative
Commons Attribution/Share-Alike License 3.0 Unported; prípadne za ďalších
podmienok. www.astronomia.sk | www.biologia.sk | www.botanika.sk | www.dejiny.sk | www.economy.sk | www.elektrotechnika.sk | www.estetika.sk | www.farmakologia.sk | www.filozofia.sk | Fyzika | www.futurologia.sk | www.genetika.sk | www.chemia.sk | www.lingvistika.sk | www.politologia.sk | www.psychologia.sk | www.sexuologia.sk | www.sociologia.sk | www.veda.sk I www.zoologia.sk |
