A | B | C | D | E | F | G | H | CH | I | J | K | L | M | N | O | P | Q | R | S | T | U | V | W | X | Y | Z | 0 | 1 | 2 | 3 | 4 | 5 | 6 | 7 | 8 | 9

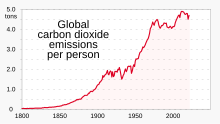
Greenhouse gas (GHG) emissions from human activities intensify the greenhouse effect. This contributes to climate change. Carbon dioxide (CO2), from burning fossil fuels such as coal, oil, and natural gas, is one of the most important factors in causing climate change. The largest emitters are China followed by the United States. The United States has higher emissions per capita. The main producers fueling the emissions globally are large oil and gas companies. Emissions from human activities have increased atmospheric carbon dioxide by about 50% over pre-industrial levels. The growing levels of emissions have varied, but have been consistent among all greenhouse gases. Emissions in the 2010s averaged 56 billion tons a year, higher than any decade before.[2] Total cumulative emissions from 1870 to 2022 were 703 GtC (2575 GtCO2), of which 484±20 GtC (1773±73 GtCO2) from fossil fuels and industry, and 219±60 GtC (802±220 GtCO2) from land use change. Land-use change, such as deforestation, caused about 31% of cumulative emissions over 1870–2022, coal 32%, oil 24%, and gas 10%.[3][4]
Carbon dioxide (CO2) is the main greenhouse gas resulting from human activities. It accounts for more than half of warming. Methane (CH4) emissions have almost the same short-term impact.[5] Nitrous oxide (N2O) and fluorinated gases (F-gases) play a lesser role in comparison. Emissions of carbon dioxide, methane and nitrous oxide in 2023 were all higher than ever before.[6]
Electricity generation, heat and transport are major emitters; overall energy is responsible for around 73% of emissions.[7] Deforestation and other changes in land use also emit carbon dioxide and methane. The largest source of anthropogenic methane emissions is agriculture, closely followed by gas venting and fugitive emissions from the fossil-fuel industry. The largest agricultural methane source is livestock. Agricultural soils emit nitrous oxide partly due to fertilizers. Similarly, fluorinated gases from refrigerants play an outsized role in total human emissions.
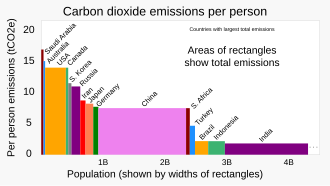
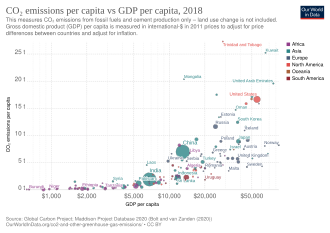
The current CO2-equivalent emission rates averaging 6.6 tonnes per person per year,[8] are well over twice the estimated rate 2.3 tons[9][10] required to stay within the 2030 Paris Agreement increase of 1.5 °C (2.7 °F) over pre-industrial levels.[11] Annual per capita emissions in the industrialized countries are typically as much as ten times the average in developing countries.[12]
The carbon footprint (or greenhouse gas footprint) serves as an indicator to compare the amount of greenhouse gases emitted over the entire life cycle from the production of a good or service along the supply chain to its final consumption.[13][14] Carbon accounting (or greenhouse gas accounting) is a framework of methods to measure and track how much greenhouse gas an organization emits.[15]
Relevance for greenhouse effect and global warming
The greenhouse effect occurs when greenhouse gases in a planet's atmosphere insulate the planet from losing heat to space, raising its surface temperature. Surface heating can happen from an internal heat source as in the case of Jupiter, or from its host star as in the case of the Earth. In the case of Earth, the Sun emits shortwave radiation (sunlight) that passes through greenhouse gases to heat the Earth's surface. In response, the Earth's surface emits longwave radiation that is mostly absorbed by greenhouse gases. The absorption of longwave radiation prevents it from reaching space, reducing the rate at which the Earth can cool off.
Without the greenhouse effect, the Earth's average surface temperature would be about −18 °C (−0.4 °F),[16][17] which is less than Earth's 20th century average of about 14 °C (57 °F), or a more recent average of about 15 °C (59 °F).[18][19] In addition to naturally present greenhouse gases, burning of fossil fuels has increased amounts of carbon dioxide and methane in the atmosphere.[20][21] As a result, global warming of about 1.2 °C (2.2 °F) has occurred since the Industrial Revolution,[22] with the global average surface temperature increasing at a rate of 0.18 °C (0.32 °F) per decade since 1981.[23]Overview of main sources

Relevant greenhouse gases
The major anthropogenic (human origin) sources of greenhouse gases are carbon dioxide (CO2), nitrous oxide (N
2O), methane, three groups of fluorinated gases (sulfur hexafluoride (SF
6), hydrofluorocarbons (HFCs) and perfluorocarbons (PFCs, sulphur hexafluoride (SF6), and nitrogen trifluoride (NF3)).[25] Though the greenhouse effect is heavily driven by water vapor,[26] human emissions of water vapor are not a significant contributor to warming.
Although CFCs are greenhouse gases, they are regulated by the Montreal Protocol which was motivated by CFCs' contribution to ozone depletion rather than by their contribution to global warming. Ozone depletion has only a minor role in greenhouse warming, though the two processes are sometimes confused in the media. In 2016, negotiators from over 170 nations meeting at the summit of the United Nations Environment Programme reached a legally binding accord to phase out hydrofluorocarbons (HFCs) in the Kigali Amendment to the Montreal Protocol.[27][28][29] The use of CFC-12 (except some essential uses) has been phased out due to its ozone depleting properties.[30] The phasing-out of less active HCFC-compounds will be completed in 2030.[31]
Human activities

Starting about 1750, industrial activity powered by fossil fuels began to significantly increase the concentration of carbon dioxide and other greenhouse gases. Emissions have grown rapidly since about 1950 with ongoing expansions in global population and economic activity following World War II. As of 2021, measured atmospheric concentrations of carbon dioxide were almost 50% higher than pre-industrial levels.[32][33]
The main sources of greenhouse gases due to human activity (also called carbon sources) are:
- Burning fossil fuels: Burning oil, coal and gas is estimated to have emitted 37.4 billion tonnes of CO2eq in 2023.[34] The largest single source is coal-fired power stations, with 20% of greenhouse gases (GHG) as of 2021.[35]
- Land use change (mainly deforestation in the tropics) accounts for about a quarter of total anthropogenic GHG emissions.[36]
- Livestock enteric fermentation and manure management,[37] paddy rice farming, land use and wetland changes, human-made lakes,[38] pipeline losses, and covered vented landfill emissions leading to higher methane atmospheric concentrations. Many of the newer style fully vented septic systems that enhance and target the fermentation process also are sources of atmospheric methane.
- Use of chlorofluorocarbons (CFCs) in refrigeration systems, and use of CFCs and halons in fire suppression systems and manufacturing processes.
- Agricultural soils emit nitrous oxide (N2O) partly due to application of fertilizers.[39]
- The largest source of anthropogenic methane emissions is agriculture, closely followed by gas venting and fugitive emissions from the fossil-fuel industry.[40][41] The largest agricultural methane source is livestock. Cattle (raised for both beef and milk, as well as for inedible outputs like manure and draft power) are the animal species responsible for the most emissions, representing about 65% of the livestock sector's emissions.[42]
Global estimates
This section needs to be updated. (April 2024) |
Global greenhouse gas emissions are about 50 Gt per year[24] and for 2019 have been estimated at 57 Gt CO2 eq including 5 Gt due to land use change.[43] In 2019, approximately 34% of total net anthropogenic GHG emissions came from the energy supply sector, 24% from industry, 22% from agriculture, forestry and other land use (AFOLU), 15% from transport and 6% from buildings.[44]
The current CO2-equivalent emission rates averaging 6.6 tonnes per person per year,[8] are well over twice the estimated rate 2.3 tons[9][10] required to stay within the 2030 Paris Agreement increase of 1.5 °C (2.7 °F) over pre-industrial levels.[11]
While cities are sometimes considered to be disproportionate contributors to emissions, per-capita emissions tend to be lower for cities than the averages in their countries.[45]
A 2017 survey of corporations responsible for global emissions found that 100 companies were responsible for 71% of global direct and indirect emissions, and that state-owned companies were responsible for 59% of their emissions.[46][47]
China is, by a significant margin, Asia's and the world's largest emitter: it emits nearly 10 billion tonnes each year, more than one-quarter of global emissions.[48] Other countries with fast growing emissions are South Korea, Iran, and Australia (which apart from the oil rich Persian Gulf states, now has the highest per capita emission rate in the world). On the other hand, annual per capita emissions of the EU-15 and the US are gradually decreasing over time.[49] Emissions in Russia and Ukraine have decreased fastest since 1990 due to economic restructuring in these countries.[50]
2015 was the first year to see both total global economic growth and a reduction of carbon emissions.[51]
High income countries compared to low income countries

Annual per capita emissions in the industrialized countries are typically as much as ten times the average in developing countries.[12]: 144 Due to China's fast economic development, its annual per capita emissions are quickly approaching the levels of those in the Annex I group of the Kyoto Protocol (i.e., the developed countries excluding the US).[49]
Africa and South America are both fairly small emitters: accounting for 3-4% of global emissions each. Both have emissions almost equal in size to international aviation and shipping.[48]
Calculations and reporting

Variables
There are several ways of measuring greenhouse gas emissions. Some variables that have been reported include:[54]
- Definition of measurement boundaries: Emissions can be attributed geographically, to the area where they were emitted (the territory principle) or by the activity principle to the territory that produced the emissions. These two principles result in different totals when measuring, for example, electricity importation from one country to another, or emissions at an international airport.
- Time horizon of different gases: The contribution of given greenhouse gas is reported as a CO2 equivalent. The calculation to determine this takes into account how long that gas remains in the atmosphere. This is not always known accurately[clarification needed] and calculations must be regularly updated to reflect new information.
- The measurement protocol itself: This may be via direct measurement or estimation. The four main methods are the emission factor-based method, mass balance method, predictive emissions monitoring systems, and continuous emissions monitoring systems. These methods differ in accuracy, cost, and usability. Public information from space-based measurements of carbon dioxide by Climate Trace is expected to reveal individual large plants before the 2021 United Nations Climate Change Conference.[55]
These measures are sometimes used by countries to assert various policy/ethical positions on climate change.[56]: 94 The use of different measures leads to a lack of comparability, which is problematic when monitoring progress towards targets. There are arguments for the adoption of a common measurement tool, or at least the development of communication between different tools.[54]
Reporting
Emissions may be tracked over long time periods, known as historical or cumulative emissions measurements. Cumulative emissions provide some indicators of what is responsible for greenhouse gas atmospheric concentration build-up.[57]: 199
National accounts balance
The national accounts balance tracks emissions based on the difference between a country's exports and imports. For many richer nations, the balance is negative because more goods are imported than they are exported. This result is mostly due to the fact that it is cheaper to produce goods outside of developed countries, leading developed countries to become increasingly dependent on services and not goods. A positive account balance would mean that more production was occurring within a country, so more operational factories would increase carbon emission levels.[58]
Emissions may also be measured across shorter time periods. Emissions changes may, for example, be measured against the base year of 1990. 1990 was used in the United Nations Framework Convention on Climate Change (UNFCCC) as the base year for emissions, and is also used in the Kyoto Protocol (some gases are also measured from the year 1995).[12]: 146, 149 A country's emissions may also be reported as a proportion of global emissions for a particular year.
Another measurement is of per capita emissions. This divides a country's total annual emissions by its mid-year population.[59]: 370 Per capita emissions may be based on historical or annual emissions.[56]: 106–107
Embedded emissions
One way of attributing greenhouse gas emissions is to measure the embedded emissions (also referred to as "embodied emissions") of goods that are being consumed. Emissions are usually measured according to production, rather than consumption.[60] For example, in the main international treaty on climate change (the UNFCCC), countries report on emissions produced within their borders, e.g., the emissions produced from burning fossil fuels.[61]: 179 [62]: 1 Under a production-based accounting of emissions, embedded emissions on imported goods are attributed to the exporting, rather than the importing, country. Under a consumption-based accounting of emissions, embedded emissions on imported goods are attributed to the importing country, rather than the exporting, country.
Zdroj:https://en.wikipedia.org?pojem=Greenhouse_gas_emissions
Text je dostupný za podmienok Creative Commons Attribution/Share-Alike License 3.0 Unported; prípadne za ďalších podmienok. Podrobnejšie informácie nájdete na stránke Podmienky použitia.
Antropológia
Aplikované vedy
Bibliometria
Dejiny vedy
Encyklopédie
Filozofia vedy
Forenzné vedy
Humanitné vedy
Knižničná veda
Kryogenika
Kryptológia
Kulturológia
Literárna veda
Medzidisciplinárne oblasti
Metódy kvantitatívnej analýzy
Metavedy
Metodika
Text je dostupný za podmienok Creative
Commons Attribution/Share-Alike License 3.0 Unported; prípadne za ďalších
podmienok.
Podrobnejšie informácie nájdete na stránke Podmienky
použitia.
www.astronomia.sk | www.biologia.sk | www.botanika.sk | www.dejiny.sk | www.economy.sk | www.elektrotechnika.sk | www.estetika.sk | www.farmakologia.sk | www.filozofia.sk | Fyzika | www.futurologia.sk | www.genetika.sk | www.chemia.sk | www.lingvistika.sk | www.politologia.sk | www.psychologia.sk | www.sexuologia.sk | www.sociologia.sk | www.veda.sk I www.zoologia.sk
