

A | B | C | D | E | F | G | H | CH | I | J | K | L | M | N | O | P | Q | R | S | T | U | V | W | X | Y | Z | 0 | 1 | 2 | 3 | 4 | 5 | 6 | 7 | 8 | 9
| Demographics of Cambodia | |
|---|---|
 Cambodia population pyramid in 2020 | |
| Population | 16,946,438 |
| Growth rate | |
| Birth rate | 19.3 births/1,000 population (2021 est.)[1] |
| Death rate | 6.8 deaths/1,000 population (2021 est.) |
| Life expectancy | 69.6 years (2018 est.)[2] |
| • male | 67.3 years |
| • female | 71.6 years |
| Fertility rate | 2.34 children born/woman (2021 est.) |
| Infant mortality rate | 24 deaths/1,000 live births (2018 est.)[3] |
| Net migration rate | |
| Age structure | |
| 0–14 years | 28.59% |
| 15–64 years | 65.26% |
| 65 and over | 6.15% |
| Sex ratio | |
| Total | 0.94 male(s)/female (2013) |
| At birth | 1.05 male(s)/female |
| 65 and over | 0.6 male(s)/female |
| Nationality | |
| Nationality | noun: Cambodian(s), Khmer(s); Kampuchean(s) (historical) adjective: Cambodian, Khmer; Kampuchean (historical) |
| Major ethnic | Khmer |
| Minor ethnic | Chinese, Vietnamese, Cham, and others |
| Language | |
| Official | Khmer |
Demographic features of the population of Cambodia include population density, ethnicity, education level, health of the populace, economic status, religious affiliations and other aspects of the population.
Population
| Year | Pop. | ±% |
|---|---|---|
| 1876 | 890,000 | — |
| 1901 | 1,103,000 | +23.9% |
| 1911 | 1,487,900 | +34.9% |
| 1921 | 2,402,600 | +61.5% |
| 1931 | 2,806,000 | +16.8% |
| 1947 | 3,296,000 | +17.5% |
| 1951 | 4,261,000 | +29.3% |
| 1961 | 5,510,000 | +29.3% |
| 1971 | 7,270,000 | +31.9% |
| 1981 | 6,682,000 | −8.1% |
| 1991 | 8,810,000 | +31.8% |
| 2001 | 12,353,000 | +40.2% |
| 2011 | 14,701,717 | +19.0% |
| 2021 | 16,946,438 | +15.3% |
| Source: CIA World Factbook | ||

Between 1874 and 1921, the total population of Cambodia increased from about 946,000 to 2.4 million. By 1950, it had increased to between 3,710,107 and 4,073,967, and in 1962 it had reached 5.7 million. From the 1960s until 1975, the population of Cambodia increased by about 2.2% yearly, the lowest increase in Southeast Asia.
By 1975 when the Khmer Rouge took power, the population was estimated at 7.3 million. Of this total an estimated one to two million reportedly died between 1975 and 1978. In 1981, the PRK gave the official population figure as nearly 6.7 million, although approximately 6.3 million to 6.4 million is probably more accurate.
The average annual rate of population growth from 1978 to 1985 was 2.3% (see table 2, Appendix A). A post-Khmer Rouge baby boom pushed the population above 10 million, although growth has slowed in recent years.
In 1959, about 45% of the population was under 15 years of age. By 1962, this had increased slightly to 46%. In 1962, an estimated 52% of the population was between 15 and 64 years of age, while 2% were older than 65. The percentage of males and females in the three groups was almost the same.
Population and age distribution
-
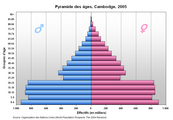 Cambodian Population Pyramid-2005
 -
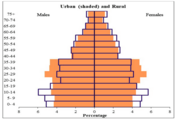 Population pyramid, urban-rural, Cambodia, 2019[4]


Graphs are unavailable due to technical issues. There is more info on Phabricator and on MediaWiki.org. |
Graphs are unavailable due to technical issues. There is more info on Phabricator and on MediaWiki.org. |
Graphs are unavailable due to technical issues. There is more info on Phabricator and on MediaWiki.org. |
Graphs are unavailable due to technical issues. There is more info on Phabricator and on MediaWiki.org. |
| Year[5] | Total population (thousands) | Population percentage | ||
|---|---|---|---|---|
| aged 0–14 | aged 15–64 | aged 65+ | ||
| 1950 | 4 346 | 42.2% |
55.1% |
2.7% |
| 1955 | 4 840 | 42.3% |
55.0% |
2.7% |
| 1960 | 5 433 | 42.5% |
54.8% |
2.7% |
| 1965 | 6 141 | 42.8% |
54.4% |
2.7% |
| 1970 | 6 938 | 43.2% |
54.0% |
2.8% |
| 1975 | 7 308 | 42.3% |
54.9% |
2.8% |
| 1980 | 6 306 | 39.0% |
58.1% |
2.9% |
| 1985 | 7 920 | 42.1% |
55.0% |
2.9% |
| 1990 | 9 532 | 43.8% |
53.4% |
2.8% |
| 1995 | 11 169 | 47.5% |
49.7% |
2.8% |
| 2000 | 12 447 | 41.6% |
55.4% |
3.0% |
| 2005 | 13 358 | 36.4% |
60.3% |
3.3% |
| 2010 | 14 138 | 31.9% |
64.3% |
3.8% |
| 2015 | 15 521 | 31.6% |
64.3% |
4.1% |
| 2020 | 16 719 | 30.9% |
64.2% |
4.9% |
Structure of the population
| Age Group | Male | Female | Total | % |
|---|---|---|---|---|
| Total | 7 320 112 | 7 642 479 | 14 962 591 | 100 |
| 0–4 | 806 531 | 777 854 | 1 584 385 | 10.59 |
| 5–9 | 721 480 | 693 339 | 1 414 819 | 9.46 |
| 10–14 | 768 899 | 735 963 | 1 504 862 | 10.06 |
| 15–19 | 878 612 | 830 980 | 1 709 592 | 11.43 |
| 20–24 | 848 931 | 800 737 | 1 649 668 | 11.03 |
| 25–29 | 678 825 | 712 044 | 1 390 869 | 9.30 |
| 30–34 | 613 674 | 637 973 | 1 251 647 | 8.37 |
| 35–39 | 338 735 | 363 397 | 702 132 | 4.69 |
| 40–44 | 411 072 | 441 415 | 852 487 | 5.70 |
| 45–49 | 344 372 | 395 214 | 739 586 | 4.94 |
| 50–54 | 295 645 | 352 214 | 648 347 | 4.33 |
| 55–59 | 190 528 | 288 806 | 479 334 | 3.20 |
| 60–64 | 153 721 | 218 867 | 372 588 | 2.49 |
| 65–69 | 105 605 | 147 502 | 253 107 | 1.69 |
| 70–74 | 76 017 | 108 069 | 184 086 | 1.23 |
| 75–79 | 47 601 | 72 558 | 120 159 | 0.80 |
| 80+ | 39 864 | 65 059 | 104 923 | 0.70 |
| Age group | Male | Female | Total | Percent |
| 0–14 | 2 296 910 | 2 207 156 | 4 504 066 | 30.10 |
| 15–64 | 4 754 115 | 5 042 135 | 9 796 250 | 65.47 |
| 65+ | 269 087 | 393 188 | 662 275 | 4.43 |
| Age Group | Male | Female | Total | % |
|---|---|---|---|---|
| Total | 8 093 453 | 8 498 636 | 16 592 089 | 100 |
| 0–4 | 791 593 | 755 468 | 1 547 061 | 9.32 |
| 5–9 | 792 080 | 756 481 | 1 548 561 | 9.33 |
| 10–14 | 843 604 | 804 317 | 1 647 921 | 9.93 |
| 15–19 | 799 876 | 773 934 | 1 573 810 | 9.49 |
| 20–24 | 647 446 | 666 588 | 1 314 034 | 7.92 |
| 25–29 | 684 545 | 720 947 | 1 405 492 | 8.47 |