A | B | C | D | E | F | G | H | CH | I | J | K | L | M | N | O | P | Q | R | S | T | U | V | W | X | Y | Z | 0 | 1 | 2 | 3 | 4 | 5 | 6 | 7 | 8 | 9


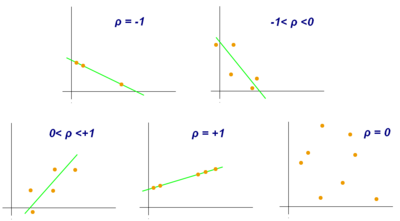
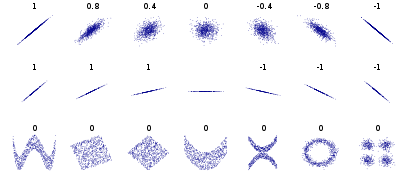
In statistics, the Pearson correlation coefficient (PCC)[a] is a correlation coefficient that measures linear correlation between two sets of data. It is the ratio between the covariance of two variables and the product of their standard deviations; thus, it is essentially a normalized measurement of the covariance, such that the result always has a value between −1 and 1. As with covariance itself, the measure can only reflect a linear correlation of variables, and ignores many other types of relationships or correlations. As a simple example, one would expect the age and height of a sample of teenagers from a high school to have a Pearson correlation coefficient significantly greater than 0, but less than 1 (as 1 would represent an unrealistically perfect correlation).
Naming and history
It was developed by Karl Pearson from a related idea introduced by Francis Galton in the 1880s, and for which the mathematical formula was derived and published by Auguste Bravais in 1844.[b][6][7][8][9] The naming of the coefficient is thus an example of Stigler's Law.
Definition
Pearson's correlation coefficient is the covariance of the two variables divided by the product of their standard deviations. The form of the definition involves a "product moment", that is, the mean (the first moment about the origin) of the product of the mean-adjusted random variables; hence the modifier product-moment in the name.[verification needed]
For a population
Pearson's correlation coefficient, when applied to a population, is commonly represented by the Greek letter ρ (rho) and may be referred to as the population correlation coefficient or the population Pearson correlation coefficient. Given a pair of random variables (for example, Height and Weight), the formula for ρ[10] is[11]
where
- is the covariance
- is the standard deviation of
- is the standard deviation of .
The formula for can be expressed in terms of mean and expectation. Since[10]
the formula for can also be written as
where
- and are defined as above
- is the mean of
- is the mean of
- is the expectation.
The formula for can be expressed in terms of uncentered moments. Since
Antropológia
Aplikované vedy
Bibliometria
Dejiny vedy
Encyklopédie
Filozofia vedy
Forenzné vedy
Humanitné vedy
Knižničná veda
Kryogenika
Kryptológia
Kulturológia
Literárna veda
Medzidisciplinárne oblasti
Metódy kvantitatívnej analýzy
Metavedy
Metodika
Text je dostupný za podmienok Creative
Commons Attribution/Share-Alike License 3.0 Unported; prípadne za ďalších
podmienok.
Podrobnejšie informácie nájdete na stránke Podmienky
použitia.
www.astronomia.sk | www.biologia.sk | www.botanika.sk | www.dejiny.sk | www.economy.sk | www.elektrotechnika.sk | www.estetika.sk | www.farmakologia.sk | www.filozofia.sk | Fyzika | www.futurologia.sk | www.genetika.sk | www.chemia.sk | www.lingvistika.sk | www.politologia.sk | www.psychologia.sk | www.sexuologia.sk | www.sociologia.sk | www.veda.sk I www.zoologia.sk


