A | B | C | D | E | F | G | H | CH | I | J | K | L | M | N | O | P | Q | R | S | T | U | V | W | X | Y | Z | 0 | 1 | 2 | 3 | 4 | 5 | 6 | 7 | 8 | 9

In probability theory and statistics, skewness is a measure of the asymmetry of the probability distribution of a real-valued random variable about its mean. The skewness value can be positive, zero, negative, or undefined.
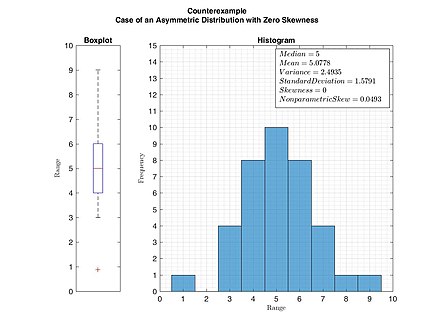
For a unimodal distribution (a distribution with a single peak), negative skew commonly indicates that the tail is on the left side of the distribution, and positive skew indicates that the tail is on the right. In cases where one tail is long but the other tail is fat, skewness does not obey a simple rule. For example, a zero value in skewness means that the tails on both sides of the mean balance out overall; this is the case for a symmetric distribution but can also be true for an asymmetric distribution where one tail is long and thin, and the other is short but fat. Thus, the judgement on the symmetry of a given distribution by using only its skewness is risky; the distribution shape must be taken into account.
Introduction
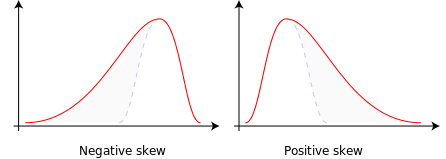
Consider the two distributions in the figure just below. Within each graph, the values on the right side of the distribution taper differently from the values on the left side. These tapering sides are called tails, and they provide a visual means to determine which of the two kinds of skewness a distribution has:
- negative skew: The left tail is longer; the mass of the distribution is concentrated on the right of the figure. The distribution is said to be left-skewed, left-tailed, or skewed to the left, despite the fact that the curve itself appears to be skewed or leaning to the right; left instead refers to the left tail being drawn out and, often, the mean being skewed to the left of a typical center of the data. A left-skewed distribution usually appears as a right-leaning curve.[1]
- positive skew: The right tail is longer; the mass of the distribution is concentrated on the left of the figure. The distribution is said to be right-skewed, right-tailed, or skewed to the right, despite the fact that the curve itself appears to be skewed or leaning to the left; right instead refers to the right tail being drawn out and, often, the mean being skewed to the right of a typical center of the data. A right-skewed distribution usually appears as a left-leaning curve.[1]
Skewness in a data series may sometimes be observed not only graphically but by simple inspection of the values. For instance, consider the numeric sequence (49, 50, 51), whose values are evenly distributed around a central value of 50. We can transform this sequence into a negatively skewed distribution by adding a value far below the mean, which is probably a negative outlier, e.g. (40, 49, 50, 51). Therefore, the mean of the sequence becomes 47.5, and the median is 49.5. Based on the formula of nonparametric skew, defined as the skew is negative. Similarly, we can make the sequence positively skewed by adding a value far above the mean, which is probably a positive outlier, e.g. (49, 50, 51, 60), where the mean is 52.5, and the median is 50.5.
As mentioned earlier, a unimodal distribution with zero value of skewness does not imply that this distribution is symmetric necessarily. However, a symmetric unimodal or multimodal distribution always has zero skewness.

Relationship of mean and median
The skewness is not directly related to the relationship between the mean and median: a distribution with negative skew can have its mean greater than or less than the median, and likewise for positive skew.[2]

In the older notion of nonparametric skew, defined as where is the mean, is the median, and is the standard deviation, the skewness is defined in terms of this relationship: positive/right nonparametric skew means the mean is greater than (to the right of) the median, while negative/left nonparametric skew means the mean is less than (to the left of) the median. However, the modern definition of skewness and the traditional nonparametric definition do not always have the same sign: while they agree for some families of distributions, they differ in some of the cases, and conflating them is misleading.
If the distribution is symmetric, then the mean is equal to the median, and the distribution has zero skewness.[3] If the distribution is both symmetric and unimodal, then the mean = median = mode. This is the case of a coin toss or the series 1,2,3,4,... Note, however, that the converse is not true in general, i.e. zero skewness (defined below) does not imply that the mean is equal to the median.
A 2005 journal article points out:[2]
Many textbooks teach a rule of thumb stating that the mean is right of the median under right skew, and left of the median under left skew. This rule fails with surprising frequency. It can fail in multimodal distributions, or in distributions where one tail is long but the other is heavy. Most commonly, though, the rule fails in discrete distributions where the areas to the left and right of the median are not equal. Such distributions not only contradict the textbook relationship between mean, median, and skew, they also contradict the textbook interpretation of the median.

For example, in the distribution of adult residents across US households, the skew is to the right. However, since the majority of cases is less than or equal to the mode, which is also the median, the mean sits in the heavier left tail. As a result, the rule of thumb that the mean is right of the median under right skew failed.[2]
Definition
Fisher's moment coefficient of skewness
The skewness of a random variable X is the third standardized moment , defined as:[4][5]
where μ is the mean, σ is the standard deviation, E is the expectation operator, μ3 is the third central moment, and κt are the t-th cumulants. It is sometimes referred to as Pearson's moment coefficient of skewness,[5] or simply the moment coefficient of skewness,[4] but should not be confused with Pearson's other skewness statistics (see below). The last equality expresses skewness in terms of the ratio of the third cumulant κ3 to the 1.5th power of the second cumulant κ2. This is analogous to the definition of kurtosis as the fourth cumulant normalized by the square of the second cumulant. The skewness is also sometimes denoted Skew.
If σ is finite and μ is finite too, then skewness can be expressed in terms of the non-central moment E by expanding the previous formula:
Examplesedit
Skewness can be infinite, as when
where the third cumulants are infinite, or as when
Antropológia
Aplikované vedy
Bibliometria
Dejiny vedy
Encyklopédie
Filozofia vedy
Forenzné vedy
Humanitné vedy
Knižničná veda
Kryogenika
Kryptológia
Kulturológia
Literárna veda
Medzidisciplinárne oblasti
Metódy kvantitatívnej analýzy
Metavedy
Metodika
Text je dostupný za podmienok Creative
Commons Attribution/Share-Alike License 3.0 Unported; prípadne za ďalších
podmienok.
Podrobnejšie informácie nájdete na stránke Podmienky
použitia.
www.astronomia.sk | www.biologia.sk | www.botanika.sk | www.dejiny.sk | www.economy.sk | www.elektrotechnika.sk | www.estetika.sk | www.farmakologia.sk | www.filozofia.sk | Fyzika | www.futurologia.sk | www.genetika.sk | www.chemia.sk | www.lingvistika.sk | www.politologia.sk | www.psychologia.sk | www.sexuologia.sk | www.sociologia.sk | www.veda.sk I www.zoologia.sk


