

A | B | C | D | E | F | G | H | CH | I | J | K | L | M | N | O | P | Q | R | S | T | U | V | W | X | Y | Z | 0 | 1 | 2 | 3 | 4 | 5 | 6 | 7 | 8 | 9

The U.S. state of South Carolina is located in the Southern United States. It is the 23rd largest state by population, with a population of 5,118,425 according to 2020 United States Census estimates.[1]
Demographics
| Census | Pop. | Note | %± |
|---|---|---|---|
| 1790 | 249,073 | — | |
| 1800 | 345,591 | 38.8% | |
| 1810 | 415,115 | 20.1% | |
| 1820 | 502,741 | 21.1% | |
| 1830 | 581,185 | 15.6% | |
| 1840 | 594,398 | 2.3% | |
| 1850 | 668,507 | 12.5% | |
| 1860 | 703,708 | 5.3% | |
| 1870 | 705,606 | 0.3% | |
| 1880 | 995,577 | 41.1% | |
| 1890 | 1,151,149 | 15.6% | |
| 1900 | 1,340,316 | 16.4% | |
| 1910 | 1,515,400 | 13.1% | |
| 1920 | 1,683,724 | 11.1% | |
| 1930 | 1,738,765 | 3.3% | |
| 1940 | 1,899,804 | 9.3% | |
| 1950 | 2,117,027 | 11.4% | |
| 1960 | 2,382,594 | 12.5% | |
| 1970 | 2,590,516 | 8.7% | |
| 1980 | 3,121,820 | 20.5% | |
| 1990 | 3,486,703 | 11.7% | |
| 2000 | 4,012,012 | 15.1% | |
| 2010 | 4,625,384 | 15.3% | |
| 2020 | 5,118,425 | 10.7% | |
| Source: 1910–2020[2] | |||
South Carolina's center of population is 2.4 mi (3.9 km) north of the State House in the city of Columbia.[3]
According to the United States Census Bureau, as of 2020, South Carolina had an estimated population of 5,118,425, which is an increase of 493,041, or 10.7%, since the year 2010.
According to the University of South Carolina's Arnold School of Public Health, Consortium for Latino Immigration Studies, South Carolina's foreign-born population grew faster than any other state between 2000 and 2005.[4] The Consortium reports that the number of Hispanics in South Carolina is greatly undercounted by census enumerators and may be more than 400,000.[4][5]
| By race | White | Black | AIAN* | Asian | NHPI* |
|---|---|---|---|---|---|
| 2000 (total population) | 68.88% | 30.01% | 0.69% | 1.13% | 0.10% |
| 2000 (Hispanic only) | 2.05% | 0.26% | 0.05% | 0.03% | 0.02% |
| 2005 (total population) | 69.12% | 29.68% | 0.69% | 1.31% | 0.10% |
| 2005 (Hispanic only) | 2.95% | 0.27% | 0.06% | 0.04% | 0.02% |
| Growth 2000–05 (total population) | 6.43% | 4.89% | 6.09% | 23.49% | 13.76% |
| Growth 2000–05 (non-Hispanic only) | 5.01% | 4.87% | 4.61% | 23.16% | 10.36% |
| Growth 2000–05 (Hispanic only) | 52.78% | 7.64% | 23.97% | 34.25% | 26.89% |
| * AIAN is American Indian or Alaskan Native; NHPI is Native Hawaiian or Pacific Islander | |||||
South Carolina’s population increased by 15.4 percent between 1990 and 2000 and by another 7.4 percent between 2000 and 2005; 11.6 percent of that increase has been attributed to immigration, primarily from Mexico and Latin America. Most work in the construction industry, with another proportion in agriculture, in addition to processing factories. The Latino population has increased considerably faster in South Carolina and the Southeast than for the United States as a whole.[6]
The five largest ancestry groups in South Carolina identified by respondents to the US census are African American (29.5%), American (13.9%), English (8.4%), German (8.4%), and Irish (7.9%) (thus a total of more than 39% from northern Europe).[7]
From 1720 until 1920, African slaves and their descendants made up a majority of the state's population. (See census data below.) Whites became a majority in the state after that date, following the migration of tens of thousands of blacks to northern industrial cities in the Great Migration. In the 21st century, most of the African-American population in the state lives in the Lowcountry and the Midlands areas, historically areas of their greatest concentrations of population.[citation needed]
6.6% of South Carolina's total population were reported as under 5 years old, 25.2% under 18, and 12.1% were 65 or older. Females made up approximately 51.4% of the population in 2000. Those who self-identify as having American ancestry are of mostly British Isles ancestry: English and Scots-Irish stock.[citation needed]
Birth data
Note: Births in table do not add up, because Hispanics are counted both by their ethnicity and by their race, giving a higher overall number.
| Race | 2013[8] | 2014[9] | 2015[10] | 2016[11] | 2017[12] | 2018[13] | 2019[14] | 2020[15] | 2021[16] | 2022[17] |
|---|---|---|---|---|---|---|---|---|---|---|
| White (NH) | 33,085 (58.2%) | 33,639 (58.4%) | 33,927 (58.4%) | 32,929 (57.4%) | 32,283 (56.6%) | 31,890 (56.3%) | 31,660 (55.5%) | 30,465 (54.7%) | 31,841 (55.7%) | 32,323 (55.9%) |
| Black | 18,591 (32.7%) | 18,598 (32.3%) | 18,577 (32.0%) | 16,527 (28.8%) | 16,851 (29.5%) | 16,681 (29.4%) | 16,802 (29.5%) | 16,309 (29.3%) | 16,009 (28.0%) | 15,333 (26.5%) |
| Asian | 1,235 (2.2%) | 1,293 (2.2%) | 1,289 (2.2%) | 1,134 (2.0%) | 1,125 (2.0%) | 1,172 (2.1%) | 1,155 (2.0%) | 1,148 (2.1%) | 1,167 (2.0%) | 1,176 (2.0%) |
| American Indian | 201 (0.3%) | 193 (0.3%) | 217 (0.4%) | 151 (0.3%) | 183 (0.3%) | 156 (0.3%) | 176 (0.3%) | 106 (0.2%) | 122 (0.2%) | 198 (0.3%) |
| Hispanic (of Native American race) | 4,411 (7.8%) | 4,646 (8.1%) | 4,942 (8.5%) | 5,135 (8.9%) | 5,221 (9.2%) | 5,255 (9.3%) | 5,741 (10.1%) | 5,993 (10.7%) | 6,386 (11.2%) | 7,073 (12.2%) |
| Total South Carolina | 56,795 (100%) | 57,627 (100%) | 58,139 (100%) | 57,342 (100%) | 57,029 (100%) | 56,669 (100%) | 57,038 (100%) | 55,704 (100%) | 57,185 (100%) | 57,820 (100%) |
- Since 2016, data for births of White Hispanic origin are not collected, but included in one Hispanic group; persons of Hispanic origin may be of any race.
- NH = Non-hispanic
Center of population

Most populous counties
| County | Seat | 2000 Population | 2010 Population | 2017 Population |
|---|---|---|---|---|
| Greenville | Greenville | 379,616 | 451,225 | 506,837 |
| Richland | Columbia | 320,667 | 384,504 | 411,592 |
| Charleston | Charleston | 309,969 | 350,209 | 401,438 |
| Horry | Conway | 196,629 | 269,291 | 333,268 |
| Spartanburg | Spartanburg | 253,431 | 284,307 | 306,854 |
| Lexington | Lexington | 216,014 | 254,920 | 290,642 |
| York | York | 164,614 | 229,073 | 266,439 |
| Berkeley | Moncks Corner | 142,651 | 177,843 | 217,937 |
| Anderson | Anderson | 165,740 | 187,126 | 198,759 |
| Beaufort | Beaufort | 120,937 | 162,233 | 186,844 |
Cities and towns
-
 Charleston – Columbus Street
 -
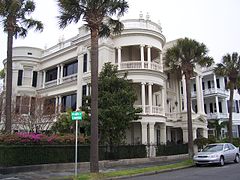 Charleston – Atlantic Street at E. Battery Street
 -
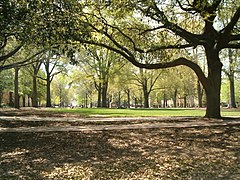 Columbia – USC Horseshoe – listed on National Register of Historic Places
 -
 Columbia – Skyline from Arsenal Hill
 -
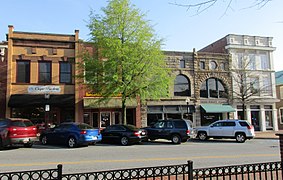 Spartanburg – Historical buildings on West Main
 -
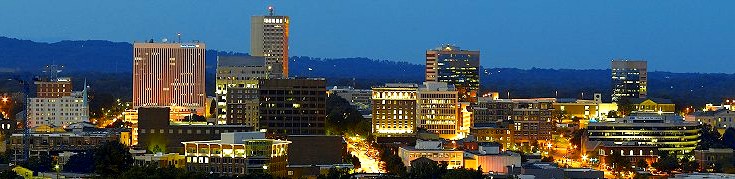 Greenville – Skyline by night
 -
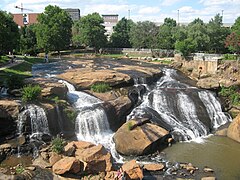 Greenville – Falls in Downtown area.
 -
 Hilton Head Island – Harbour Town
 -
 North Charleston – City Hall
 -


Largest municipalities
Population estimates as of 2010.
- Columbia – 129,272
- Charleston – 120,083
- North Charleston – 97,471
- Mount Pleasant – 67,843
- Rock Hill – 66,154
- Greenville – 58,409
- Summerville – 43,392
- Sumter- 40,524
- Hilton Head Island – 37,099
- Florence – 37,056
- Spartanburg – 37,013
- Goose Creek – 35,938
- Aiken – 29,524
- Myrtle Beach – 27,109
- Anderson – 26,686
- Greer – 25,515
- Greenwood – 23,222
- Mauldin – 22,889
- North Augusta – 21,348
- Easley – 19,993
City and MSAs
South Carolina's metropolitan statistical areas (MSAs) are much larger than their central city population counts suggest. South Carolina law makes it difficult for municipalities to annex unincorporated areas, so city proper populations look smaller than is reflected in the total metropolitan populations.
For example, Myrtle Beach has a municipal population of less than 50,000 persons, but its MSA has more than 200,000 persons. Anderson's municipal population is smaller than Sumter's, but the Anderson MSA is larger, as seen below.
Columbia, Charleston, and Greenville all have urbanized area populations between 400,000 and 550,000, while their metropolitan statistical area (MSA) populations are each more than 600,000. The Greenville-Spartanburg-Anderson MSA population consists of approximately 1.4 million people, making it the largest in the state and third largest in the Carolinas.
Urban Area Population
As of 2010:[18]
- Columbia – 549,777
- Charleston/North Charleston - 548,404
- Greenville – 400,492
- Myrtle Beach – 215,304
- Spartanburg – 180,786
- Mauldin/Simpsonville - 120,577
- Rock Hill – 104,996
- Florence – 89,557
- Anderson – 75,702
- Sumter – 73,107
- Hilton Head Island - 68,998
Religion
.jpg)
South Carolina residents are majority Protestant Christian, with a lower percentage of people claiming no religious affiliation than the national average. The religious affiliations of the people of South Carolina are as follows:
- Christian: 78%
- Protestant: 65%
- Evangelical (e.g., Southern Baptist Convention): 35%
- Mainline Protestant (e.g., United Methodist Church): 15%
- Historically Black (e.g., African Methodist Episcopal Church):[clarification needed] 15%
- Roman Catholic: 10%
- Other Christian: 3%
- Protestant: 65%
- Other Religions: 3%
- Non-Religious: 19%[19]
Sephardic Jews have lived in the state for more than 300 years,[20][21][22] especially in and around Charleston. Many came from London, where they were merchants.[23] Until about 1830, South Carolina had the largest population of Jews in North America, most in Charleston. Some have married and assimilated into Christian society; in the 21st century, less than 1% of the total religiously affiliated people are Jewish. The proportion of Roman Catholics in the state has been increasing given migrants from the North and immigration from Latin America.
Historical demographics
Beginning in 1790, the United States Census Bureau collected the population statistics of South Carolina. The years listed prior to that are estimates and exclude the Native American population. From 1790 until 1860, the designated demographic classifications were white, black slave and free black.
Graphs are unavailable due to technical issues. There is more info on Phabricator and on MediaWiki.org. |
Following the Civil War, the racial groupings were white, black and other.
Graphs are unavailable due to technical issues. There is more info on Phabricator and on MediaWiki.org. |
The following is a list of census data for the state of South Carolina:[24]
| Census Year |
Demographic | Population | % of Pop. | % Growth |
|---|---|---|---|---|
| 1670 | White | 140 | 90.3% | – |
| Slave | 15 | 9.7% | – | |
| Total | 155 | 100% | - | |
| 1680 | White | 1,000 | 83.3% | +614.3% |
| Slave | 200 | 16.7% | +1233.3% | |
| Total | 1,200 | 100% | +674.2% | |
| 1700 | White | 3,100 | 56.4% | +210.0% |
| Slave | 2,400 | 43.6% | +1100.0% | |
| Total | 5,500 | 100% | +358.3% | |
| 1708 | White | 4,080 | 42.6% | +31.6% |
| Black Slaves | 4,100 | 42.8% | – | |
| Indian Slaves | 1,400 | 14.6% | – | |
| Total | 9,580 | 100% | +74.2% | |
| 1720 | White | 6,500 | 35.1% | +59.3% |
| Slave | 12,000 | 64.9% | +118.2% | |
| Total | 18,500 | 100% | +93.1% | |
| 1730 | White | 10,000 | 33.3% | +53.9% |
| Slave | 20,000 | 66.7% | +66.7% | |
| Total | 30,000 | 100% | +62.2% | |
| 1740
Zdroj:https://en.wikipedia.org?pojem=South_Carolina_historical_demographics Text je dostupný za podmienok Creative Commons Attribution/Share-Alike License 3.0 Unported; prípadne za ďalších podmienok. Podrobnejšie informácie nájdete na stránke Podmienky použitia.
Analytika
Antropológia Aplikované vedy Bibliometria Dejiny vedy Encyklopédie Filozofia vedy Forenzné vedy Humanitné vedy Knižničná veda Kryogenika Kryptológia Kulturológia Literárna veda Medzidisciplinárne oblasti Metódy kvantitatívnej analýzy Metavedy Metodika Text je dostupný za podmienok Creative
Commons Attribution/Share-Alike License 3.0 Unported; prípadne za ďalších
podmienok. www.astronomia.sk | www.biologia.sk | www.botanika.sk | www.dejiny.sk | www.economy.sk | www.elektrotechnika.sk | www.estetika.sk | www.farmakologia.sk | www.filozofia.sk | Fyzika | www.futurologia.sk | www.genetika.sk | www.chemia.sk | www.lingvistika.sk | www.politologia.sk | www.psychologia.sk | www.sexuologia.sk | www.sociologia.sk | www.veda.sk I www.zoologia.sk |