

A | B | C | D | E | F | G | H | CH | I | J | K | L | M | N | O | P | Q | R | S | T | U | V | W | X | Y | Z | 0 | 1 | 2 | 3 | 4 | 5 | 6 | 7 | 8 | 9
Walsall Metropolitan Borough Council elections
...Walsall Metropolitan Borough Council elections are held three years out of every four, with a third of the council elected each time. Walsall Metropolitan Borough Council, which styles itself "Walsall Council", is the local authority for the metropolitan district of Walsall in the West Midlands, England. Since the last boundary changes in 2004, 60 councillors have been elected from 20 wards.[1]
Council elections
- 1998 Walsall Metropolitan Borough Council election
- 1999 Walsall Metropolitan Borough Council election
- 2000 Walsall Metropolitan Borough Council election
- 2002 Walsall Metropolitan Borough Council election
- 2003 Walsall Metropolitan Borough Council election
- 2004 Walsall Metropolitan Borough Council election (whole council elected after boundary changes)[2][1]
- 2006 Walsall Metropolitan Borough Council election
- 2007 Walsall Metropolitan Borough Council election
- 2008 Walsall Metropolitan Borough Council election
- 2010 Walsall Metropolitan Borough Council election
- 2011 Walsall Metropolitan Borough Council election
- 2012 Walsall Metropolitan Borough Council election
- 2014 Walsall Metropolitan Borough Council election
- 2015 Walsall Metropolitan Borough Council election
- 2016 Walsall Metropolitan Borough Council election
- 2018 Walsall Metropolitan Borough Council election
- 2019 Walsall Metropolitan Borough Council election
- 2021 Walsall Metropolitan Borough Council election
- 2022 Walsall Metropolitan Borough Council election
- 2023 Walsall Metropolitan Borough Council election
Borough result maps
-
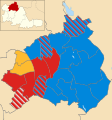 2004 results map
 -
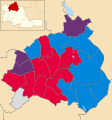
 2006 results map
 -
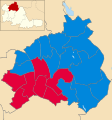
 2007 results map
 -
 2008 results map
 -
 2010 results map
 -
 2011 results map
 -
 2012 results map
 -
 2014 results map
 -
 2015 results map
 -
 2016 results map
 -
 2018 results map
 -
 2019 results map
 -
 2021 results map
 -
 2022 results map
 -
 2023 results map


By-election results
1994-1998
| Party | Candidate | Votes | % | ±% | |
|---|---|---|---|---|---|
| Labour | 734 | 37.8 | |||
| Independent | 563 | 28.9 | |||
| Conservative | 411 | 21.1 | |||
| Democratic Labour | 195 | 10.0 | |||
| Liberal Democrats | 32 | 1.6 | |||
| National Front | 13 | 0.7 | |||
| Majority | 171 | 8.9 | |||
| Turnout | 1,948 | 21.4 | |||
| Labour gain from Independent | Swing | ||||
2002-2006
| Party | Candidate | Votes | % | ±% | |
|---|---|---|---|---|---|
| Conservative | 1,251 | 47.9 | -10.1 | ||
| Independent | 750 | 28.7 | +18.9 | ||
| Labour | 264 | 10.1 | -8.5 | ||
| Liberal Democrats | 178 | 6.8 | -6.8 | ||
| UKIP | 87 | 3.3 | +3.3 | ||
| Independent | 84 | 3.2 | +3.2 | ||
| Majority | 501 | 19.2 | |||
| Turnout | 2,614 | 26.7 | |||
| Conservative hold | Swing | ||||
| Party | Candidate | Votes | % | ±% | |
|---|---|---|---|---|---|
| Conservative | 1,009 | 41.1 | -2.9 | ||
| Independent | 539 | 22.0 | +0.8 | ||
| Liberal Democrats | 416 | 17.0 | +6.0 | ||
| Labour | 285 | 11.6 | +0.0 | ||
| UKIP | 204 | 8.3 | +8.3 | ||
| Majority | 470 | 19.1 | |||
| Turnout | 2,453 | 23.3 | |||
| Conservative hold | Swing | ||||
| Party | Candidate | Votes | % | ±% | |
|---|---|---|---|---|---|
| Conservative | Eddie Hughes | 1,009 | 35.3 | -16.3 | |
| BNP | William Locke | 746 | 26.1 | +26.1 | |
| Labour | Ann Wilson | 650 | 22.7 | -12.8 | |
| Independent | Lynette Benford | 268 | 9.4 | +9.4 | |
| Socialist Alliance | Louise Bradburn | 188 | 6.6 | +6.6 | |
| Majority | 263 | 9.2 | |||
| Turnout | 2,861 | 28.9 | |||
| Conservative hold | Swing | ||||