

A | B | C | D | E | F | G | H | CH | I | J | K | L | M | N | O | P | Q | R | S | T | U | V | W | X | Y | Z | 0 | 1 | 2 | 3 | 4 | 5 | 6 | 7 | 8 | 9


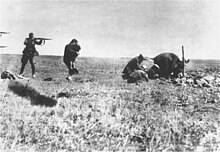

World War II was the deadliest military conflict in history. An estimated total of 70–85 million people perished, or about 3% of the estimated global population of 2.3 billion in 1940.[1] Deaths directly caused by the war (including military and civilian fatalities) are estimated at 50–56 million, with an additional estimated 19–28 million deaths from war-related disease and famine. Civilian deaths totaled 50–55 million. Military deaths from all causes totaled 21–25 million, including deaths in captivity of about 5 million prisoners of war. More than half of the total number of casualties are accounted for by the dead of the Republic of China and of the Soviet Union. The following tables give a detailed country-by-country count of human losses. Statistics on the number of military wounded are included whenever available.
Recent historical scholarship has shed new light on the topic of Second World War casualties. Research in Russia since the collapse of the Soviet Union has caused a revision of estimates of Soviet World War II fatalities.[2] According to Russian government figures, USSR losses within postwar borders now stand at 26.6 million,[3][4] including 8 to 9 million due to famine and disease.[4][5][2] In August 2009 the Polish Institute of National Remembrance (IPN) researchers estimated Poland's dead at between 5.6 and 5.8 million.[6] Historian Rüdiger Overmans of the Military History Research Office (Germany) published a study in 2000 estimating the German military dead and missing at 5.3 million, including 900,000 men conscripted from outside of Germany's 1937 borders, in Austria, and in east-central Europe.[7][8] The Red Army claimed responsibility for the majority of Wehrmacht casualties during World War II.[9] The People's Republic of China puts its war dead at 20 million,[10] while the Japanese government puts its casualties due to the war at 3.1 million.[11] An estimated 7–10 million people died in the Dutch, British, French and US colonies in South and Southeast Asia, mostly from war-related famine.[12][13][14][15][16]
Classification of casualties
Compiling or estimating the numbers of deaths and wounded caused during wars and other violent conflicts is a controversial subject. Historians often put forward many different estimates of the numbers killed and wounded during World War II.[17] The authors of the Oxford Companion to World War II maintain that "casualty statistics are notoriously unreliable".[18] The table below gives data on the number of dead and military wounded for each country, along with population information to show the relative impact of losses. When scholarly sources differ on the number of deaths in a country, a range of war losses is given, in order to inform readers that the death toll is disputed. Since casualty statistics are sometimes disputed the footnotes to this article present the different estimates by official governmental sources as well as historians. Military figures include battle deaths (KIA) and personnel missing in action (MIA), as well as fatalities due to accidents, disease and deaths of prisoners of war in captivity. Civilian casualties include deaths caused by strategic bombing, Holocaust victims, German war crimes, Japanese war crimes, population transfers in the Soviet Union, Allied war crimes, and deaths due to war-related famine and disease.
The sources for the casualties of the individual countries do not use the same methods, and civilian deaths due to starvation and disease make up a large proportion of the civilian deaths in China and the Soviet Union. The losses listed here are actual deaths; hypothetical losses due to a decline in births are not included with the total dead. The distinction between military and civilian casualties caused directly by warfare and collateral damage is not always clear-cut. For states that suffered huge losses such as the Soviet Union, China, Poland, Germany, and Yugoslavia, sources can give only the total estimated population loss caused by the war and a rough estimate of the breakdown of deaths caused by military activity, crimes against humanity and war-related famine. The casualties listed here include 19 to 25 million war-related famine deaths in the USSR, China, Indonesia, Vietnam, the Philippines, and India that are often omitted from other compilations of World War II casualties.[19][20]
The footnotes give a detailed breakdown of the casualties and their sources, including data on the number of wounded where reliable sources are available.
Human losses by country
Total deaths by country
| Country | Total population 1/1/1939 |
Military deaths from all causes |
Civilian deaths due to military activity and crimes against humanity |
Civilian deaths due to war-related famine and disease |
Total deaths |
Deaths as % of 1939 population |
Average Deaths as % of 1939 population |
Military wounded |
|---|---|---|---|---|---|---|---|---|
| 1,073,000[21] | 30,000[22] | 30,000 | 2.80 | 2.80 | NA | |||
| 6,968,000[21] | 39,700[23] | 700[24] | 40,400 | 0.58 | 0.58 | 39,803[25] | ||
| 6,653,000[21] | Included with Germany | Included with Germany | (See table below.) S2 | (See table below.) S2 | Included with Germany | |||
| 8,387,000[21] | 12,000[26] | 76,000[26] | 88,000 | 1.05 | 1.05 | 55,513[25] | ||
| 40,289,000[21] | 1,000[25] | 1,000[27] | 2,000 | 0.00 | 0.00 | 4,222[25] | ||
| 6,458,000[21] | 18,500[25] | 3,000[28] | 21,500 | 0.33 | 0.33 | 21,878[25] | ||
| 16,119,000[21] | 2,600[29] | 250,000[29] to 1,000,000[30] | 252,600 to 1,000,000 | 1.57 to 6.2 | 3.89 | NA | ||
| 11,267,000[21] | 42,000[31] | 1,600[32] | 43,600 | 0.38 | 0.38 | 53,174[25] | ||
| 517,568,000[21] | 3,000,000[33] to 3,750,000+[34] |
7,357,000[35] to 8,191,000[36] |
5,000,000 to 10,000,000 |
15,000,000[37] to 20,000,000[37] |
2.90 to 3.86 | 3.38 | 1,761,335[25] | |
| 4,235,000[21] | 100[27] | 100 | 0.00 | 0.00 | NA | |||
| 14,612,000[38] | 35,000[39] to 46,000[40] |
294,000[40] to 320,000[39] |
340,000 to 355,000 | 2.33 to 2.43 | 2.38 | 8,017[25] | ||
| 3,795,000[21] | 6,000[41] | 6,000 | 0.16 | 0.16 | 2,000[25] | |||
| 69,435,000[21] | 11,500[42][43] | 300,000[15] | 2,400,000[14] to 4,000,000[44] |
3,000,000 to 4,000,000 |
4.3 to 5.76 | 5.03 | NA | |
| 16,492,000[21] | 1,100[45] | 1,100 | 0.00 | 0.00 | NA | |||
| 1,134,000[21] | 34,000 (in both Soviet & German armed forces)[46] | 49,000[47] | 83,000 | 7.3 | 7.3 | NA | ||
| 17,700,000[21] | 15,000[48] | 85,000 | 100,000[48] | 0.56 | 0.56 | NA | ||
| 3,700,000[21] | 94,700[49] | 2,100[50][51] | 96,800 | 2.62 | 2.62 | 197,000[50] | ||
| 41,680,000[51] | 210,000[51] | 390,000[51] | 600,000 | 1.44 | 1.44 | 390,000[25] | ||
| 24,664,000[21] | 1,000,000 to 2,000,000[52] |
1,000,000 to 2,200,000 |
4.05 to 8.11 | 6.08 | NA | |||
| 69,300,000[53] | 4,440,000[54] to 5,318,000[55] | 1,500,000 to 3,000,000 S1 |
6,900,000 to 7,400,000 |
(See table below.) S2 | (See table below.) S2 | 7,300,000[25] | ||
| 7,222,000[21] | 35,100[56] | 171,800[56] | 300,000[57] to 600,000[56] |
507,000 to 807,000 |
7.02 to 11.17 | 9.095 | 47,290[25] | |
| 22,800[21] | 1,000[58] to 2,000[59] |
1,000 to 2,000 |
4.39 to 8.77 | 6.58 | NA | |||
| 9,129,000[21] | 200,000[60] | 264,000 to 664,000[61] |
464,000 to 864,000 |
5.08 to 9.46 | 7.27 | 89,313[25] | ||
| 118,900[21] | 200[62] | 200 | 0.17 | 0.17 | NA | |||
| 377,800,000[21] | 87,000[63] | 2,100,000[64] to 3,000,000[65] |
2,200,000 to 3,087,000 |
0.58 | 0.58 | 64,354[25] | ||
| 3,698,000[21] | 500[66] | 200[67] | 700 | 0.01 | 0.01 | NA | ||
| 2,960,000[21] | 5,000 Irish volunteers' deaths included with UK Armed Forces[68] | 100[69] | 5,100 | 0.00 | 0.17 | NA | ||
| 44,394,000[21] | 319,200[70] to 341,000 Italian nationals and c. 20,000 Africans conscripted by Italy[71][72] | 153,200[73] | 492,400 to 514,000 | 1.11 to 1.16 | 1.135 | 225,000[25] to 320,000[74] (incomplete data) | ||
| 71,380,000[21] | 2,100,000[75] to 2,300,000[76] |
550,000[77] to 800,000[78] |
2,500,000[79] to 3,100,000[80] |
3.50 to 4.34 | 3.92 | 326,000[25] | ||
| 24,326,000[21] | Included with Japanese military | 483,000[81] to 533,000[82] |
483,000 to 533,000 |
1.99 to 2.19 | 2.09 | NA | ||
| 1,994,500[21] | 30,000[83] (in both Soviet and German Armies) | 220,000[84] | 250,000 | 12.5 | 12.5 | NA | ||
| 2,575,000[21] | 25,000[85] (in both Soviet and German Armies) | 345,000[86] | 370,000 | 14.36 | 14.36 | NA | ||
| 290,000[87] | 2,905[87] Included with German & Allied military | 4,201[87] | 7,106[87] | 2.45 | 2.45 | NA | ||
| 5,118,000[21] | 100,000[88] | 100,000 | 1.95 | 1.95 | NA | |||
| 269,000[21] | Included with U.K. | 1,500[89] | 1,500 | 0.55 | 0.55 | NA | ||
| 19,320,000[21] | 100[27] | 100 | 0.00 | 0.00 | NA | |||
| 819,000[21] | 300[90] | 300 | 0.04 | 0.04 | NA | |||
| 3,400[21] | 500[91] | 500 | 14.7 | 14.7 | NA | |||
| 6,087,000[21] | Included with British Indian Army | NA | ||||||
| 8,729,000[21] | 6,700[92] | 187,300[92] | 16,000[92] | 250,000[93] | 2.86 | 2.86 | 2,860[25] | |
| 320,000[21] | 1,100[94] (included with the U.K. & Canada) | 100[95] | 1,200 | 0.3 | 0.3 | (included with the/ U.K. & Canada) | ||
| 1,629,000[21] | 11,700[96] | 11,700 | 0.72 | 0.72 | 19,314[25] | |||
| 2,945,000[21] | 2,000[51] | 8,200[97] | 10,200 | 0.35 | 0.35 | 364[25] | ||
| 1,292,000[21] | 15,000[98] | 15,000 | 1.16 | 1.16 | NA | |||
| 16,000,303[99] | 62,500[100] | 164,000[16] to 1,000,000[101][102][103] | 336,000[16] | 557,000 to 1,411,938[104][16][102][101][103] | 3.48 to 8.82 | 6.15 | NA | |
| 34,849,000[105] | 240,000[106] | 5,620,000[107] to 5,820,000[107] |
5,900,000[108] to 6,000,000[108] |
16.93 to 17.22 | 17.075 | 766,606[25] | ||
| 480,000[21] | 40,000[109] to 70,000[109] |
40,000 to 70,000 |
8.33 to 14.58 | 11.455 | NA |