A | B | C | D | E | F | G | H | CH | I | J | K | L | M | N | O | P | Q | R | S | T | U | V | W | X | Y | Z | 0 | 1 | 2 | 3 | 4 | 5 | 6 | 7 | 8 | 9
| Part of a series on |
| Macroeconomics |
|---|
 |

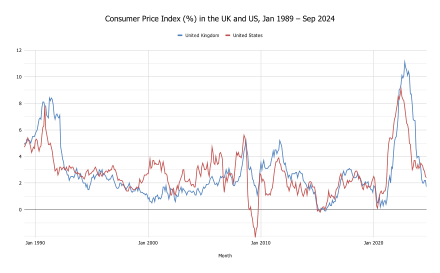
In economics, inflation is a general increase in the prices of goods and services in an economy. This is usually measured using the consumer price index (CPI).[3][4][5][6] When the general price level rises, each unit of currency buys fewer goods and services; consequently, inflation corresponds to a reduction in the purchasing power of money.[7][8] The opposite of CPI inflation is deflation, a decrease in the general price level of goods and services. The common measure of inflation is the inflation rate, the annualized percentage change in a general price index.[9] As prices faced by households do not all increase at the same rate, the consumer price index (CPI) is often used for this purpose.
Changes in inflation are widely attributed to fluctuations in real demand for goods and services (also known as demand shocks, including changes in fiscal or monetary policy), changes in available supplies such as during energy crises (also known as supply shocks), or changes in inflation expectations, which may be self-fulfilling.[10] Moderate inflation affects economies in both positive and negative ways. The negative effects would include an increase in the opportunity cost of holding money, uncertainty over future inflation, which may discourage investment and savings, and, if inflation were rapid enough, shortages of goods as consumers begin hoarding out of concern that prices will increase in the future. Positive effects include reducing unemployment due to nominal wage rigidity,[11] allowing the central bank greater freedom in carrying out monetary policy, encouraging loans and investment instead of money hoarding, and avoiding the inefficiencies associated with deflation.
Today, most economists favour a low and steady rate of inflation.[12] Low (as opposed to zero or negative) inflation reduces the probability of economic recessions by enabling the labor market to adjust more quickly in a downturn and reduces the risk that a liquidity trap prevents monetary policy from stabilizing the economy while avoiding the costs associated with high inflation.[13] The task of keeping the rate of inflation low and stable is usually given to central banks that control monetary policy, normally through the setting of interest rates and by carrying out open market operations.[10]
Terminology
The term originates from the Latin inflare (to blow into or inflate). Conceptually, inflation refers to the general trend of prices, not changes in any specific price. For example, if people choose to buy more cucumbers than tomatoes, cucumbers consequently become more expensive and tomatoes less expensive. These changes are not related to inflation; they reflect a shift in tastes. Inflation is related to the value of currency itself. When currency was linked with gold, if new gold deposits were found, the price of gold and the value of currency would fall, and consequently, prices of all other goods would become higher.[14]
Classical economics
By the nineteenth century, economists categorised three separate factors that cause a rise or fall in the price of goods: a change in the value or production costs of the good, a change in the price of money which then was usually a fluctuation in the commodity price of the metallic content in the currency, and currency depreciation resulting from an increased supply of currency relative to the quantity of redeemable metal backing the currency. Following the proliferation of private banknote currency printed during the American Civil War, the term "inflation" started to appear as a direct reference to the currency depreciation that occurred as the quantity of redeemable banknotes outstripped the quantity of metal available for their redemption. At that time, the term inflation referred to the devaluation of the currency, and not to a rise in the price of goods.[15] This relationship between the over-supply of banknotes and a resulting depreciation in their value was noted by earlier classical economists such as David Hume and David Ricardo, who would go on to examine and debate what effect a currency devaluation has on the price of goods.[16]
Related concepts
Other economic concepts related to inflation include: deflation – a fall in the general price level;[17] disinflation – a decrease in the rate of inflation;[18] hyperinflation – an out-of-control inflationary spiral;[19] stagflation – a combination of inflation, slow economic growth and high unemployment;[20] reflation – an attempt to raise the general level of prices to counteract deflationary pressures;[21] and asset price inflation – a general rise in the prices of financial assets without a corresponding increase in the prices of goods or services;[22] agflation – an advanced increase in the price for food and industrial agricultural crops when compared with the general rise in prices.[23]
More specific forms of inflation refer to sectors whose prices vary semi-independently from the general trend. "House price inflation" applies to changes in the house price index[24] while "energy inflation" is dominated by the costs of oil and gas.[25]
History

Overview
Inflation has been a feature of history during the entire period when money has been used as a means of payment. One of the earliest documented inflations occurred in Alexander the Great's empire 330 BCE.[26] Historically, when commodity money was used, periods of inflation and deflation would alternate depending on the condition of the economy. However, when large, prolonged infusions of gold or silver into an economy occurred, this could lead to long periods of inflation.
The adoption of fiat currency by many countries, from the 18th century onwards, made much larger variations in the supply of money possible.[27] Rapid increases in the money supply have taken place a number of times in countries experiencing political crises, producing hyperinflations – episodes of extreme inflation rates much higher than those observed in earlier periods of commodity money. The hyperinflation in the Weimar Republic of Germany is a notable example. The hyperinflation in Venezuela is the highest in the world, with an annual inflation rate of 833,997% as of October 2018.[28]
Historically, inflations of varying magnitudes have occurred, interspersed with corresponding deflationary periods,[26] from the price revolution of the 16th century, which was driven by the flood of gold and particularly silver seized and mined by the Spaniards in Latin America, to the largest paper money inflation of all time in Hungary after World War II.[29]
However, since the 1980s, inflation has been held low and stable in countries with independent central banks. This has led to a moderation of the business cycle and a reduction in variation in most macroeconomic indicators – an event known as the Great Moderation.[30]
Ancient Europe
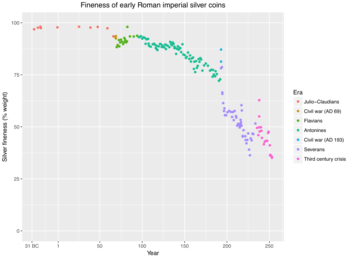
Alexander the Great's conquest of the Persian Empire in 330 BCE was followed by one of the earliest documented inflation periods in the ancient world.[26] Rapid increases in the quantity of money or in the overall money supply have occurred in many different societies throughout history, changing with different forms of money used.[31][32] For instance, when silver was used as currency, the government could collect silver coins, melt them down, mix them with other, less valuable metals such as copper or lead and reissue them at the same nominal value, a process known as debasement. At the ascent of Nero as Roman emperor in AD 54, the denarius contained more than 90% silver, but by the 270s hardly any silver was left. By diluting the silver with other metals, the government could issue more coins without increasing the amount of silver used to make them. When the cost of each coin is lowered in this way, the government profits from an increase in seigniorage.[33] This practice would increase the money supply but at the same time the relative value of each coin would be lowered. As the relative value of the coins becomes lower, consumers would need to give more coins in exchange for the same goods and services as before. These goods and services would experience a price increase as the value of each coin is reduced.[34] Again at the end of the third century CE during the reign of Diocletian, the Roman Empire experienced rapid inflation.[26]
Ancient China
Song dynasty China introduced the practice of printing paper money to create fiat currency.[35] During the Mongol Yuan dynasty, the government spent a great deal of money fighting costly wars, and reacted by printing more money, leading to inflation.[36] Fearing the inflation that plagued the Yuan dynasty, the Ming dynasty initially rejected the use of paper money, and reverted to using copper coins.[37]
Medieval Egypt
During the Malian king Mansa Musa's hajj to Mecca in 1324, he was reportedly accompanied by a camel train that included thousands of people and nearly a hundred camels. When he passed through Cairo, he spent or gave away so much gold that it depressed its price in Egypt for over a decade,[38] reducing its purchasing power. A contemporary Arab historian remarked about Mansa Musa's visit:
Gold was at a high price in Egypt until they came in that year. The mithqal did not go below 25 dirhams and was generally above, but from that time its value fell and it cheapened in price and has remained cheap till now. The mithqal does not exceed 22 dirhams or less. This has been the state of affairs for about twelve years until this day by reason of the large amount of gold which they brought into Egypt and spent there .
— Chihab Al-Umari, Kingdom of Mali[39]
Medieval age and "price revolution" in Western Europe
There is no reliable evidence of inflation in Europe for the thousand years that followed the fall of the Roman Empire, but from the Middle Ages onwards reliable data do exist. Mostly, the medieval inflation episodes were modest, and there was a tendency that inflationary periods were followed by deflationary periods.[26]
From the second half of the 15th century to the first half of the 17th, Western Europe experienced a major inflationary cycle referred to as the "price revolution",[40][41] with prices on average rising perhaps sixfold over 150 years. This is often attributed to the influx of gold and silver from the New World into Habsburg Spain,[42] with wider availability of silver in previously cash-starved Europe causing widespread inflation.[43][44] European population rebound from the Black Death began before the arrival of New World metal, and may have begun a process of inflation that New World silver compounded later in the 16th century.[45]
After 1700
A pattern of intermittent inflation and deflation periods persisted for centuries until the Great Depression in the 1930s, which was characterized by major deflation. Since the Great Depression, however, there has been a general tendency for prices to rise every year. In the 1970s and early 1980s, annual inflation in most industrialized countries reached two digits (ten percent or more). The double-digit inflation era was of short duration, however, inflation by the mid-1980s returned to more modest levels. Amid this, general trends there have been spectacular high-inflation episodes in individual countries in interwar Europe, towards the end of the Nationalist Chinese government in 1948–1949, and later in some Latin American countries, in Israel, and in Zimbabwe. Some of these episodes are considered hyperinflation periods, normally designating inflation rates that surpass 50 percent monthly.[26]
Measures
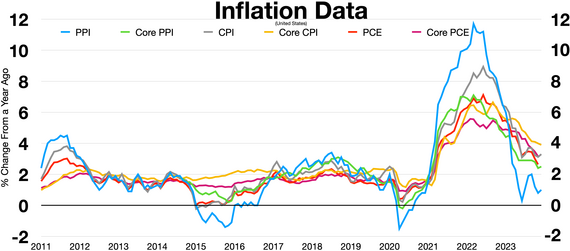
Given that there are many possible measures of the price level, there are many possible measures of price inflation. Most frequently, the term "inflation" refers to a rise in a broad price index representing the overall price level for goods and services in the economy. The consumer price index (CPI), the personal consumption expenditures price index (PCEPI) and the GDP deflator are some examples of broad price indices. However, "inflation" may also be used to describe a rising price level within a narrower set of assets, goods or services within the economy, such as commodities (including food, fuel, metals), tangible assets (such as real estate), services (such as entertainment and health care), or labor. Although the values of capital assets are often casually said to "inflate," this should not be confused with inflation as a defined term; a more accurate description for an increase in the value of a capital asset is appreciation. The FBI (CCI), the producer price index, and employment cost index (ECI) are examples of narrow price indices used to measure price inflation in particular sectors of the economy. Core inflation is a measure of inflation for a subset of consumer prices that excludes food and energy prices, which rise and fall more than other prices in the short term. The Federal Reserve Board pays particular attention to the core inflation rate to get a better estimate of long-term future inflation trends overall.[47]
The inflation rate is most widely calculated by determining the movement or change in a price index, typically the consumer price index.[48]
The inflation rate is the percentage change of a price index over time. The Retail Prices Index is also a measure of inflation that is commonly used in the United Kingdom. It is broader than the CPI and contains a larger basket of goods and services.
The RPI is indicative of the experiences of a wide range of household types, particularly low-income households.[49]
To illustrate the method of calculation, in January 2007, the U.S. Consumer Price Index was 202.416, and in January 2008 it was 211.080. The formula for calculating the annual percentage rate inflation in the CPI over the course of the year is:
The resulting inflation rate for the CPI in this one-year period is 4.28%, meaning the general level of prices for typical U.S. consumers rose by approximately four percent in 2007.[50]
Other widely used price indices for calculating price inflation include the following:
- Producer price indices (PPIs) which measures average changes in prices received by domestic producers for their output. This differs from the CPI in that price subsidization, profits, and taxes may cause the amount received by the producer to differ from what the consumer paid. There is also typically a delay between an increase in the PPI and any eventual increase in the CPI. Producer price index measures the pressure being put on producers by the costs of their raw materials. This could be "passed on" to consumers, or it could be absorbed by profits, or offset by increasing productivity. In India and the United States, an earlier version of the PPI was called the Wholesale price index.
- Commodity price indices, which measure the price of a selection of commodities. In the present commodity price indices are weighted by the relative importance of the components to the "all in" cost of an employee.
- Core price indices: because food and oil prices can change quickly due to changes in supply and demand conditions in the food and oil markets, it can be difficult to detect the long run trend in price levels when those prices are included. Therefore, most statistical agencies also report a measure of 'core inflation', which removes the most volatile components (such as food and oil) from a broad price index like the CPI. Because core inflation is less affected by short run supply and demand conditions in specific markets, central banks rely on it to better measure the inflationary effect of current monetary policy.
Other common measures of inflation are:
- GDP deflator is a measure of the price of all the goods and services included in gross domestic product (GDP). The US Commerce Department publishes a deflator series for US GDP, defined as its nominal GDP measure divided by its real GDP measure.
∴
- Regional inflation The Bureau of Labor Statistics breaks down CPI-U calculations down to different regions of the US.
- Historical inflation Before collecting consistent econometric data became standard for governments, and for the purpose of comparing absolute, rather than relative standards of living, various economists have calculated imputed inflation figures. Most inflation data before the early 20th century is imputed based on the known costs of goods, rather than compiled at the time. It is also used to adjust for the differences in real standard of living for the presence of technology.
- Asset price inflation is an undue increase in the prices of real assets, such as real estate.
In some cases, the measures are meant to be more humorous or to reflect a single place. This includes:
- The Christmas Price Index, which calculates the cost of the items mentioned in a song, "The Twelve Days of Christmas".[51]
- The Big Mac Index, which compares prices across countries.[52]
- The Jollof index, which calculates the price of food needed to make a Jollof rice, a popular African dish.[53]
- The Two Dishes One Soup Index, which calculates the price of food needed to cook one soup and two other dishes for a small family in Hong Kong.
- The Herengracht index, which calculates the price of housing in a fashionable neighborhood of Amsterdam.[54]
- The Lipstick index, which claimed that when the economy got worse, small luxury sales, such as lipstick, would go up.[55]
Issues in measuring
Measuring inflation in an economy requires objective means of differentiating changes in nominal prices on a common set of goods and services, and distinguishing them from those price shifts resulting from changes in value such as volume, quality, or performance. For example, if the price of a can of corn changes from $0.90 to $1.00 over the course of a year, with no change in quality, then this price difference represents inflation. This single price change would not, however, represent general inflation in an overall economy. Overall inflation is measured as the price change of a large "basket" of representative goods and services. This is the purpose of a price index, which is the combined price of a "basket" of many goods and services. The combined price is the sum of the weighted prices of items in the "basket". A weighted price is calculated by multiplying the unit price of an item by the number of that item the average consumer purchases. Weighted pricing is necessary to measure the effect of individual unit price changes on the economy's overall inflation. The consumer price index, for example, uses data collected by surveying households to determine what proportion of the typical consumer's overall spending is spent on specific goods and services, and weights the average prices of those items accordingly. Those weighted average prices are combined to calculate the overall price. To better relate price changes over time, indexes typically choose a "base year" price and assign it a value of 100. Index prices in subsequent years are then expressed in relation to the base year price.[56] While comparing inflation measures for various periods one has to take into consideration the base effect as well.
Inflation measures are often modified over time, either for the relative weight of goods in the basket, or in the way in which goods and services from the present are compared with goods and services from the past. Basket weights are updated regularly, usually every year, to adapt to changes in consumer behavior. Sudden changes in consumer behavior can still introduce a weighting bias in inflation measurement. For example, during the COVID-19 pandemic it has been shown that the basket of goods and services was no longer representative of consumption during the crisis, as numerous goods and services could no longer be consumed due to government containment measures ("lock-downs").[57][58]
Over time, adjustments are also made to the type of goods and services selected to reflect changes in the sorts of goods and services purchased by 'typical consumers'. New products may be introduced, older products disappear, the quality of existing products may change, and consumer preferences can shift. Both the sorts of goods and services which are included in the "basket" and the weighted price used in inflation measures will be changed over time to keep pace with the changing marketplace.[citation needed] Different segments of the population may naturally consume different "baskets" of goods and services and may even experience different inflation rates. It is argued that companies have put more innovation into bringing down prices for wealthy families than for poor families.[59]
Inflation numbers are often seasonally adjusted to differentiate expected cyclical cost shifts. For example, home heating costs are expected to rise in colder months, and seasonal adjustments are often used when measuring inflation to compensate for cyclical energy or fuel demand spikes. Inflation numbers may be averaged or otherwise subjected to statistical techniques to remove statistical noise and volatility of individual prices.[60][61]
When looking at inflation, economic institutions may focus only on certain kinds of prices, or special indices, such as the core inflation index which is used by central banks to formulate monetary policy.[62]
Most inflation indices are calculated from weighted averages of selected price changes. This necessarily introduces distortion, and can lead to legitimate disputes about what the true inflation rate is. This problem can be overcome by including all available price changes in the calculation, and then choosing the median value.[63] In some other cases, governments may intentionally report false inflation rates; for instance, during the presidency of Cristina Kirchner (2007–2015) the government of Argentina was criticised for manipulating economic data, such as inflation and GDP figures, for political gain and to reduce payments on its inflation-indexed debt.[64][65]
Inflation expectations
Inflation expectations or expected inflation is the rate of inflation that is anticipated for some time in the foreseeable future. There are two major approaches to modeling the formation of inflation expectations. Adaptive expectations models them as a weighted average of what was expected one period earlier and the actual rate of inflation that most recently occurred. Rational expectations models them as unbiased, in the sense that the expected inflation rate is not systematically above or systematically below the inflation rate that actually occurs.
A long-standing survey of inflation expectations is the University of Michigan survey.[66]
Inflation expectations affect the economy in several ways. They are more or less built into nominal interest rates, so that a rise (or fall) in the expected inflation rate will typically result in a rise (or fall) in nominal interest rates, giving a smaller effect if any on real interest rates. In addition, higher expected inflation tends to be built into the rate of wage increases, giving a smaller effect if any on the changes in real wages. Moreover, the response of inflationary expectations to monetary policy can influence the division of the effects of policy between inflation and unemployment (see monetary policy credibility).
Causes
This section may be in need of reorganization to comply with Wikipedia's layout guidelines. (February 2024) |
Historical approaches
Theories of the origin and causes of inflation have existed since at least the 16th century. Two competing theories, the quantity theory of money and the real bills doctrine, appeared in various disguises during century-long debates on recommended central bank behaviour. In the 20th century, Keynesian, monetarist and new classical (also known as rational expectations) views on inflation dominated post-World War II macroeconomics discussions, which were often heated intellectual debates, until some kind of synthesis of the various theories was reached by the end of the century.
Before 1936
The price revolution from ca. 1550–1700 caused several thinkers to present what is now considered to be early formulations of the quantity theory of money (QTM). Other contemporary authors attributed rising price levels to the debasement of national coinages. Later research has shown that also growing output of Central European silver mines and an increase in the velocity of money because of innovations in the payment technology, in particular the increased use of bills of exchange, contributed to the price revolution.[67]
An alternative theory, the real bills doctrine (RBD), originated in the 17th and 18th century, receiving its first authoritative exposition in Adam Smith's The Wealth of Nations.[68] It asserts that banks should issue their money in exchange for short-term real bills of adequate value. As long as banks only issue a dollar in exchange for assets worth at least a dollar, the issuing bank's assets will naturally move in step with its issuance of money, and the money will hold its value. Should the bank fail to get or maintain assets of adequate value, then the bank's money will lose value, just as any financial security will lose value if its asset backing diminishes. The real bills doctrine (also known as the backing theory) thus asserts that inflation results when money outruns its issuer's assets. The quantity theory of money, in contrast, claims that inflation results when money outruns the economy's production of goods.
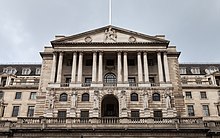
During the 19th century, three different schools debated these questions: The British Currency School upheld a quantity theory view, believing that the Bank of England's issues of bank notes should vary one-for-one with the bank's gold reserves. In contrast to this, the British Banking School followed the real bills doctrine, recommending that the bank's operations should be governed by the needs of trade: Banks should be able to issue currency against bills of trading, i.e. "real bills" that they buy from merchants. A third group, the Free Banking School, held that competitive private banks would not overissue, even though a monopolist central bank could be believed to do it.[69]
The debate between currency, or quantity theory, and banking schools during the 19th century prefigures current questions about the credibility of money in the present. In the 19th century, the banking schools had greater influence in policy in the United States and Great Britain, while the currency schools had more influence "on the continent", that is in non-British countries, particularly in the Latin Monetary Union and the Scandinavian Monetary Union.
During the Bullionist Controversy during the Napoleonic Wars, David Ricardo argued that the Bank of England had engaged in over-issue of bank notes, leading to commodity price increases. In the late 19th century, supporters of the quantity theory of money led by Irving Fisher debated with supporters of bimetallism. Later, Knut Wicksell sought to explain price movements as the result of real shocks rather than movements in money supply, resounding statements from the real bills doctrine.[67]
In 2019, monetary historians Thomas M. Humphrey and Richard Timberlake published "Gold, the Real Bills Doctrine, and the Fed: Sources of Monetary Disorder 1922–1938".[70]
Keynes and the early Keynesians
John Maynard Keynes in his 1936 main work The General Theory of Employment, Interest and Money emphasized that wages and prices were sticky in the short run, but gradually responded to aggregate demand shocks. These could arise from many different sources, e.g. autonomous movements in investment or fluctuations in private wealth or interest rates.[26] Economic policy could also affect demand, monetary policy by affecting interest rates and fiscal policy either directly through the level of government final consumption expenditure or indirectly by changing disposable income via tax changes.
The various sources of variations in aggregate demand will cause cycles in both output and price levels. Initially, a demand change will primarily affect output because of the price stickiness, but eventually prices and wages will adjust to reflect the change in demand. Consequently, movements in real output and prices will be positively, but not strongly, correlated.[26]
Keynes' propositions formed the basis of Keynesian economics which came to dominate macroeconomic research and economic policy in the first decades after World War II.[10]: 526 Other Keynesian economists developed and reformed several of Keynes' ideas. Importantly, Alban William Phillips in 1958 published indirect evidence of a negative relation between inflation and unemployment, confirming the Keynesian emphasis on a positive correlation between increases in real output (normally accompanied by a fall in unemployment) and rising prices, i.e. inflation. Phillips' findings were confirmed by other empirical analyses and became known as a Phillips curve. It quickly became central to macroeconomic thinking, apparently offering a stable trade-off between price stability and employment. The curve was interpreted to imply that a country could achieve low unemployment if it were willing to tolerate a higher inflation rate or vice versa.[10]: 173
The Phillips curve model described the U.S. experience well in the 1960s, but failed to describe the stagflation experienced in the 1970s.
Monetarism
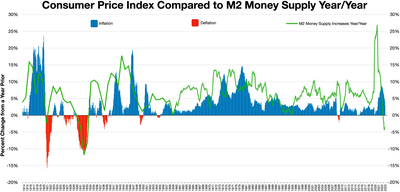

During the 1960s the Keynesian view of inflation and macroeconomic policy altogether were challenged by monetarist theories, led by Milton Friedman.[10]: 528–529 Friedman famously stated that "Inflation is always and everywhere a monetary phenomenon."[71] He revived the quantity theory of money by Irving Fisher and others, making it into a central tenet of monetarist thinking, arguing that the most significant factor influencing inflation or deflation is how fast the money supply grows or shrinks.[72]
The quantity theory of money, simply stated, says that any change in the amount of money in a system will change the price level. This theory begins with the equation of exchange:
where
- is the nominal quantity of money;
Antropológia
Aplikované vedy
Bibliometria
Dejiny vedy
Encyklopédie
Filozofia vedy
Forenzné vedy
Humanitné vedy
Knižničná veda
Kryogenika
Kryptológia
Kulturológia
Literárna veda
Medzidisciplinárne oblasti
Metódy kvantitatívnej analýzy
Metavedy
Metodika
Text je dostupný za podmienok Creative
Commons Attribution/Share-Alike License 3.0 Unported; prípadne za ďalších
podmienok.
Podrobnejšie informácie nájdete na stránke Podmienky
použitia.
www.astronomia.sk | www.biologia.sk | www.botanika.sk | www.dejiny.sk | www.economy.sk | www.elektrotechnika.sk | www.estetika.sk | www.farmakologia.sk | www.filozofia.sk | Fyzika | www.futurologia.sk | www.genetika.sk | www.chemia.sk | www.lingvistika.sk | www.politologia.sk | www.psychologia.sk | www.sexuologia.sk | www.sociologia.sk | www.veda.sk I www.zoologia.sk

